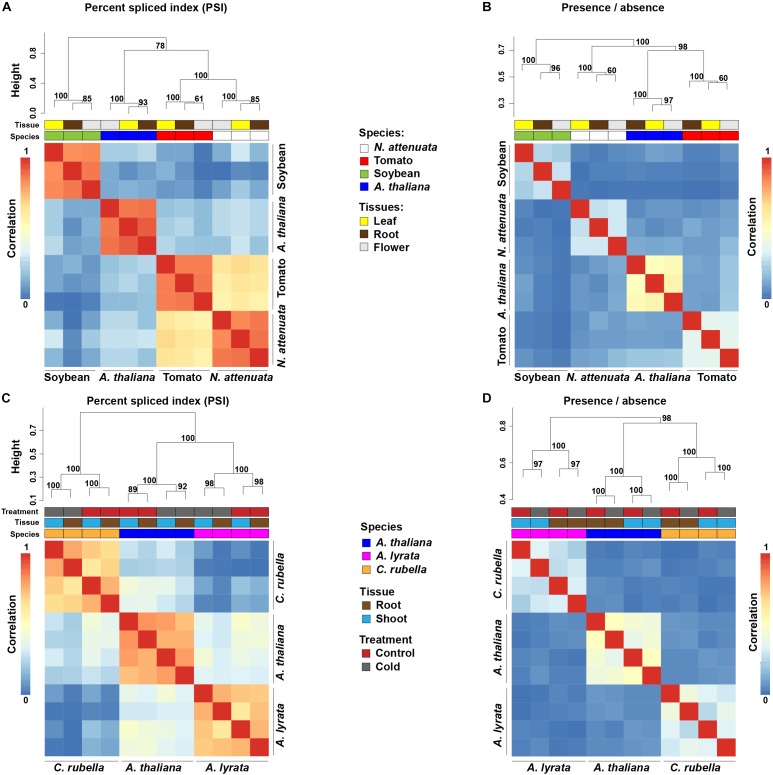
FIGURE 1.
Species-specific clustering of alternative splicing (AS) among different plant species. (A,C) Heatmaps depict species-specific clustering based on PSI values among four eudicots species (A) and three Brassicaceae species (C). The clustering is based on conserved splicing junctions (A,C: n = 502 and 5241, respectively). (B,D) Heatmaps depict species-specific clustering based on presence and absence of AS of the one-to-one orthologous genes. In total, junctions from 3,857 (B) and 6,262 (D) orthologous were used for the clustering. Numbers at each branch node represent the approximately unbiased bootstrap value calculated from 1,000 bootstrap replications. The color code above each heatmap represents species, tissue, and treatments.

