
FIGURE 4.
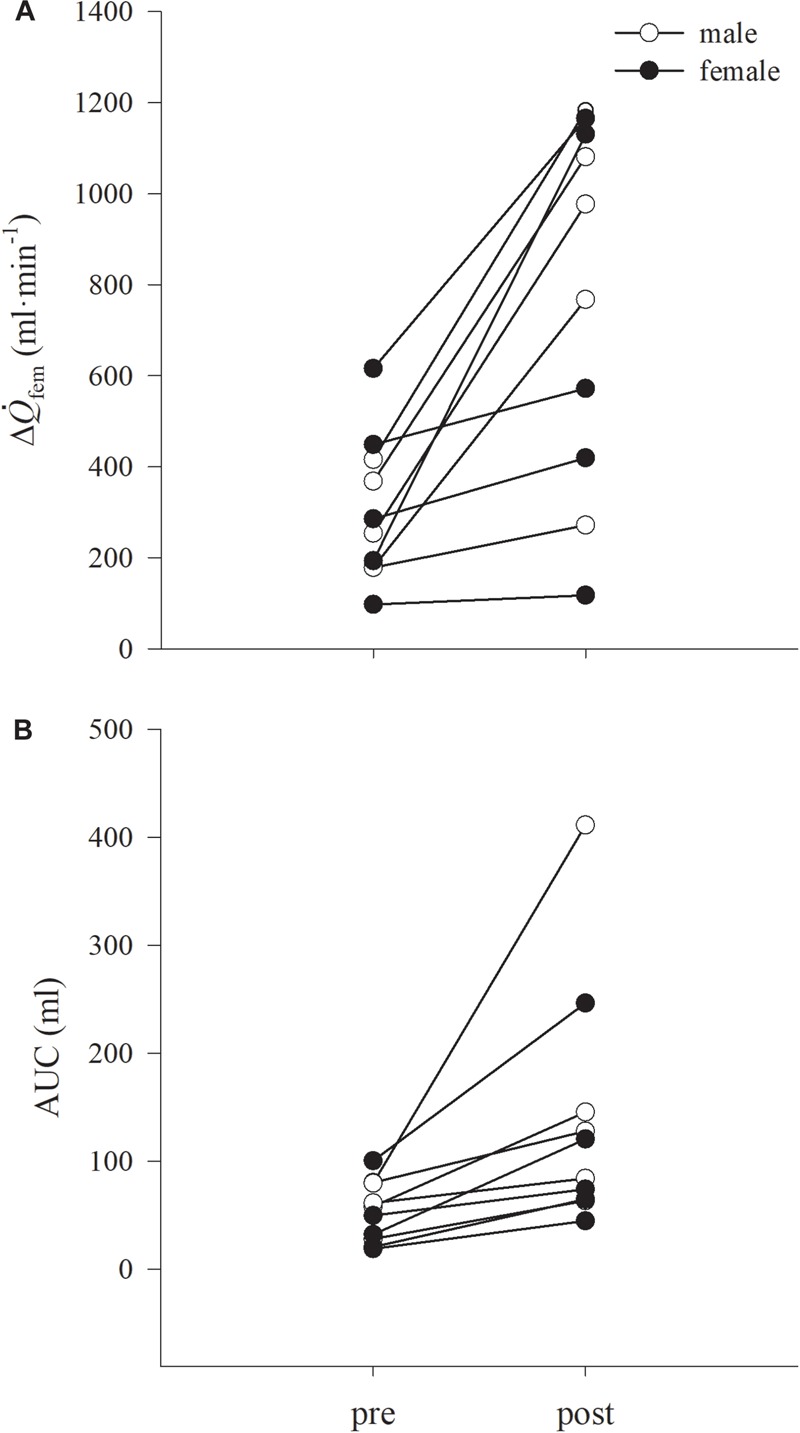
Individual data for changes in difference between rest and maximum femoral artery blood flow during passive limb movement (PLM), (Δ fem, A) and cumulative blood flow, expressed as AUC (B), are shown. Males and females are represented in open and closed circles, respectively. Data are presented as mean ± SD.