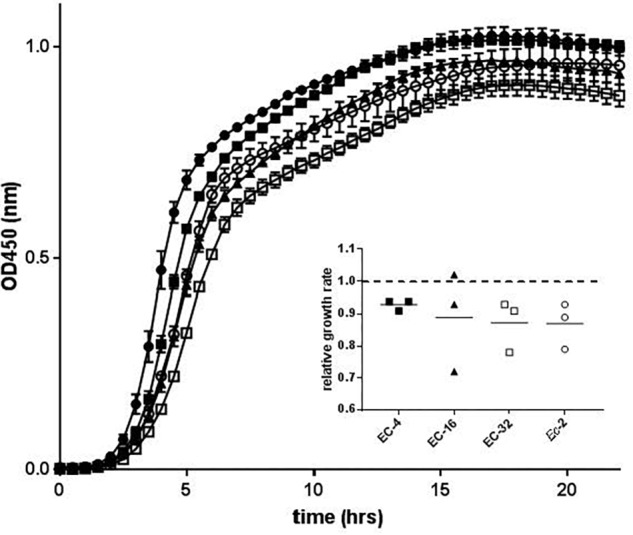
FIGURE 2.

Growth kinetics of strain Ec-1 and its in vitro and in vivo mutant derivatives. The mean OD450 (±SEM) over time of three biological replicates is shown for Ec-1 (filled circles), EC-4 (filled squares), EC-16 (filled triangles), EC-32 (open squares), and Ec-2 (open circles). The inset shows the relative growth rate in minutes for each mutant strain compared to the parental strain.
