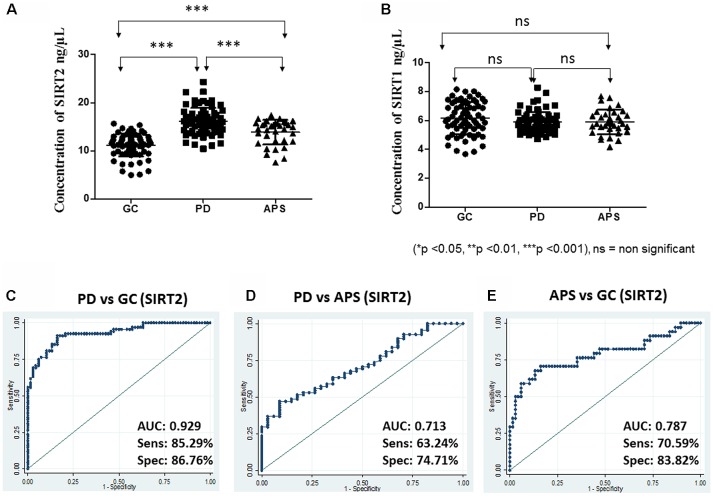
Figure 1.
Scatter plot of serum (A) Sirtuin 2 (SIRT2) and (B) SIRT1 concentration in elderly control (GC), Parkinson’s disease (PD) and atypical parkinson syndrome (APS) by one-way ANOVA with Bonferroni correction. Receiver operating characteristic (ROC) curves of serum SIRT2 between different groups: (C) PD vs. GC, (D) PD vs. APS and (E) APS vs. GC. ***p < 0.001; ns, non-significant.

