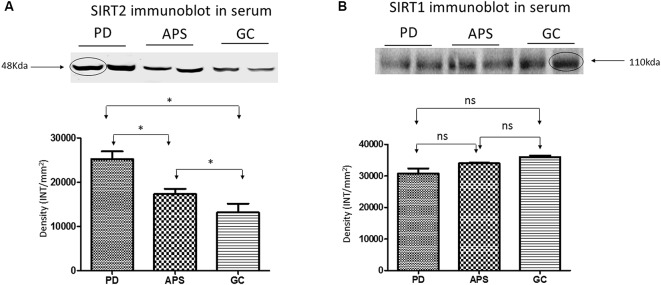
Figure 3.
Western blot and density analysis by one-way ANOVA with Bonferroni correction of (A) SIRT2 and (B) SIRT1 in the serum of PD, APS and GC. Lane 1–2 (PD), Lane 3–4 (APS), Lane 5–6 (GC). Histograms representing normalized mean integrated density ± standard deviation values. *p < 0.05; ns, non-significant.

