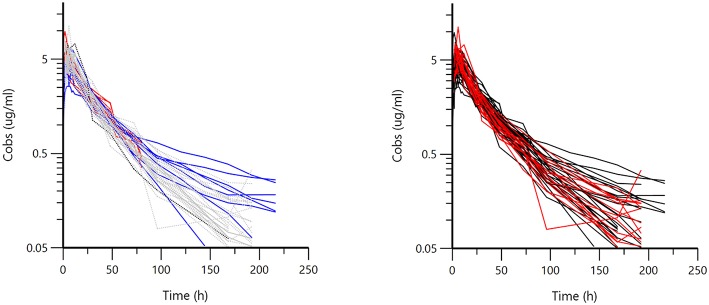
Figure 1.
Semi-logarithmic spaghetti plot for 50 calves sorted by sources (left) (Red = A, Gray = B, Blue = C) or by formulation (right) (Black = Nuflor®, Red = generic). Visual inspection of the plots does not suggest major differences either between the three sources of data or for the two formulations, as seen from the intermingling of the curves.

