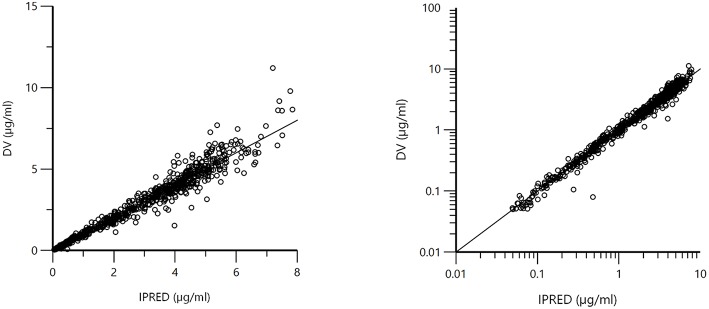
Figure 3.
Plot of the dependent variable (DV) i.e., observed plasma florfenicol concentration (μg/ml) vs. individual predicted plasma florfenicol values (IPRED). Individual prediction was obtained by setting random effects to the “post-hoc” or empirical Bayesian estimate of the random effects for the individual from which the DV observation was made. Thus, the plots illustrate observed vs. fitted values of the model function. Ideally they should fall close to the line of unity y = x. Arithmetic scale (left) and logarithmic scale (right). For both the arithmetic and logarithmic scales, data were evenly distributed about the line of identity, indicating no major bias in the population component of the model.

