
Figure 4.
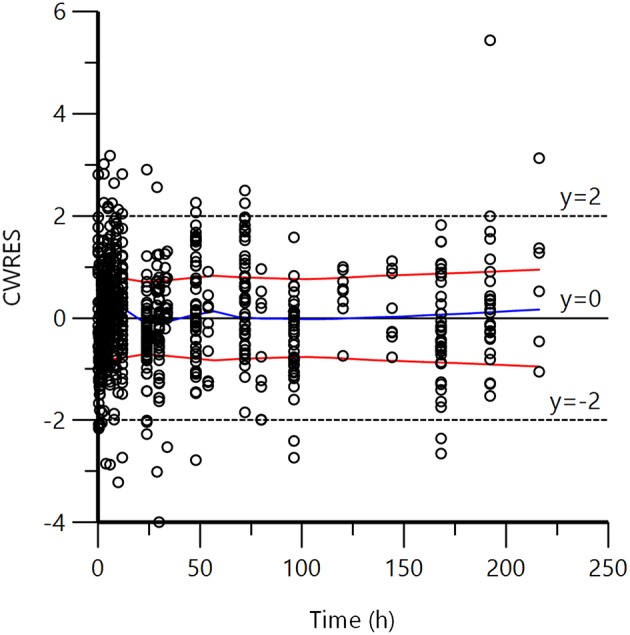
Plot of CWRES (conditional weighted residuals) against time after dose (h). Values of CWRES should be approximately N (0, 1) and hence concentrated between y = −2 and y = +2. Inspection of the figure shows that data were evenly distributed about zero (see the trends as given by the blue line) and the red line (with its negative reflection) did not show any fanning, indicating no bias in the structural model.