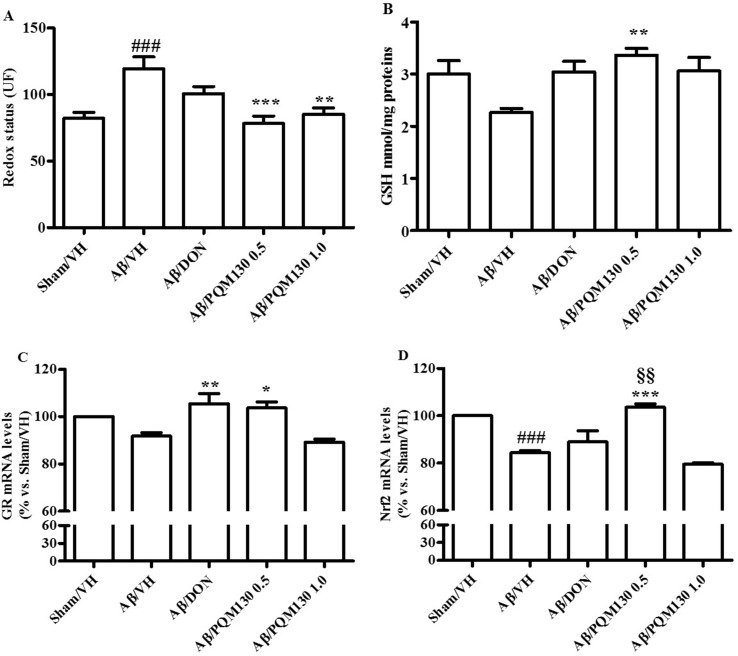
Figure 7.
Effects of donepezil and PQM130 treatments (0.5 or 1.0 mg/kg) on cellular redox status in the Aβ1-42O-injected mice. Redox status was evaluated in the hippocampal samples based on DCF’s fluorescence emission at 535 nm after excitation at 485 nm. The values are expressed as mean ± SEM (n = 10) of fluorescence intensity arbitrary units (UF) of each experimental group (A). GSH content was measured using a colorimetric assay in the hippocampal samples. The values are calculated using a standard calibration curve and expressed as mean ± SEM (n = 10) of mmol GSH/mg protein (B). GR and Nrf2 mRNA relative expressions (C and D) were determined through the 2−ΔΔCt method and presented as percentage vs. the Sham/VH group. ACTB was used as control housekeeping gene. (A: ### p < 0.001 vs. Sham/VH, **p < 0.01 and ***p < 0.001 vs. Aβ/VH; B: **p < 0.01 vs. Aβ/VH group; C: *p < 0.05 and **p < 0.01 vs. Aβ/VH group; D: ### p < 0.001 vs. Sham/VH group, ***p < 0.001 vs. Aβ/VH group, §§ p < 0.01 vs. Aβ/DON group; ANOVA, post hoc test Bonferroni).

