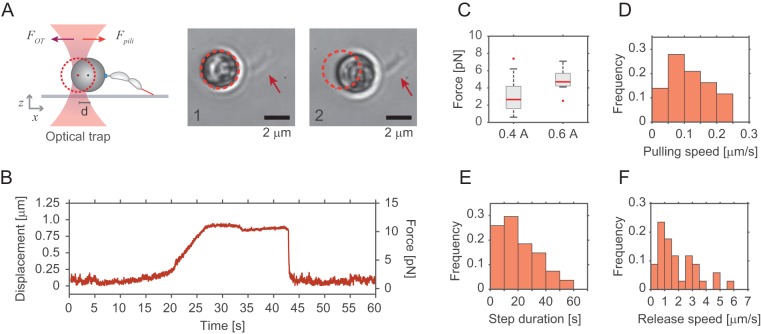
FIG 4.
Optical tweezers determine pilus retraction force and speed. (A) Schematic representation of the experimental setup used for optical trap measurements of pilus retraction forces. Beads with late predivisional cells attached via their holdfast were trapped and maneuvered toward the surface to allow pili extending from the opposite pole (red) to attach. Upon pilus retraction, bead displacement was measured. Images on the right show a representative example of a bead with one attached predivisional cell (arrow) before (image 1) and after (image 2) retraction. Note that the trapped bead was displaced by about 1 μm. (B) Pilus-mediated displacement of trapped beads over time. The plot is representative of an optical tweezer measurement, showing the displacement and the respective forces generated by pilus retraction. (C and D) Force and pulling velocity measurements of pilus retraction. (C) Median values (red line) and quartiles (boxes) of force generated by pilus retraction. Outliers are plotted as red points. The measurements were conducted with the laser power of the optical trap maintained at either 0.4 A (n = 100) or 0.6 A (n = 11). (D) Speed of retraction of individual pili with the laser power set at 0.4 A. (E and F) Step duration and pilus release time. (E) Durations of pilus retraction were quantified as the time from the start of bead displacement to the moment of bead release (n = 28). (F) Speed with which the bead moved back into the center of the trap at the end of individual step events (n = 34).

