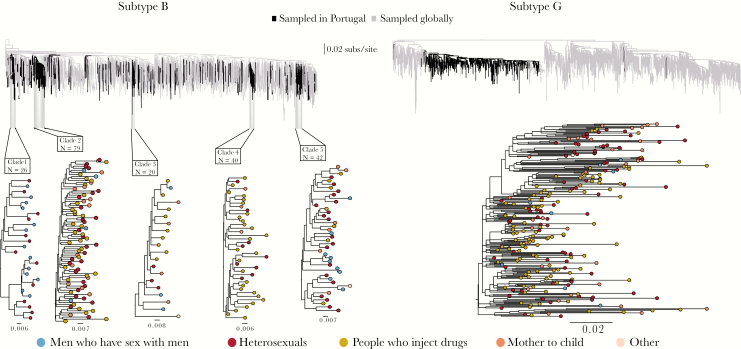
Figure 2.
Top, Maximum likelihood (ML) phylogenetic trees reconstructed from the combined data sets, showing human immunodeficiency virus type subtype B (left) and subtype G (right). The black color indicates Portuguese sequences and is used to highlight their position on the global diversity trees. The highlighted clades are the clades of at least 10 sequences with a within-clade genetic distance <6% and a Shimodaira-Hasegawa–like statistical support >90%. Bottom, ML phylogenetic trees of the identified phylogenetic clades. The colors of the tips represent the transmission group of a patient from whom the sequence was sampled.

