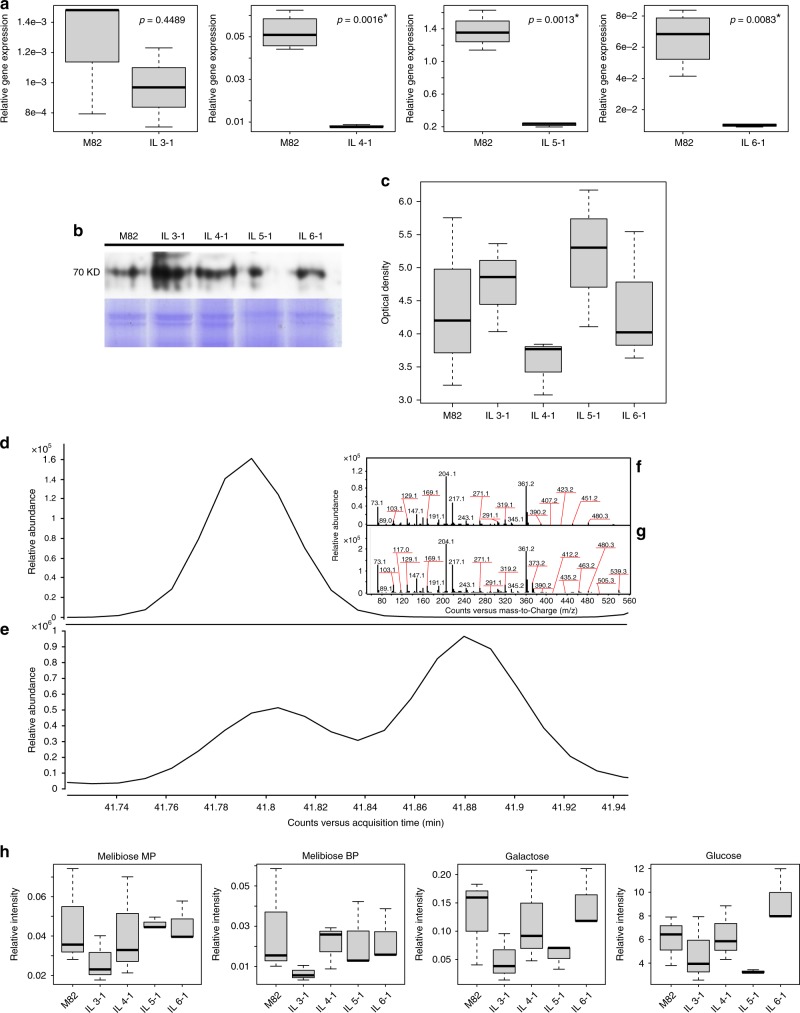
Fig. 6.
In vivo validation of the melibiose degradation pathway in the tomato pericarp. a Boxplot representation of quantitative analysis of transcripts with real-time RT-PCR performed for genes Solyc03g019790 on introgression line (IL) 3-1, Solyc04g008730 on IL 4-1, Solyc05g013720 on IL 5-1, and Solyc06g050130 on IL 6-1. The center lines represent the median; box limits represent upper and lower quartiles; whiskers represent 1.5 × interquartile range. The expression of each line was compared with M82 after normalization to SGN-U314153. The data represents the mean obtained for representative experiments from three independent biological replications. The Student’s t-test was applied to compare the relative expression levels. The values denoted by asterisk are significantly different (in which * indicates p < 0.05; ** indicates p < 0.01; and *** indicates p < 0.001). b Immunological analysis of α-galactosidase against corresponding barley antibodies. c Boxplot of colorimetric assay using p-nitrophenyl-α-D-galactopyranoside (pNPGal) as artificial substrate to test for α-galactosidase activity. The center line represents the median; box limits represent upper and lower quartiles; whiskers represent 1.5 × interquartile range. d Eluted melibiose standard chromatogram. e Tomato pericarp melibiose chromatogram. f Deconvoluted spectra of melibiose standard. g Deconvoluted spectra of melibiose in tomato pericarp. h Boxplot of quantitative analysis of melibiose main and byproduct, glucose, and galactose. Error bars represent standard deviation. The center lines represent the median; box limits represent upper and lower quartiles; whiskers represent 1.5 × interquartile range

