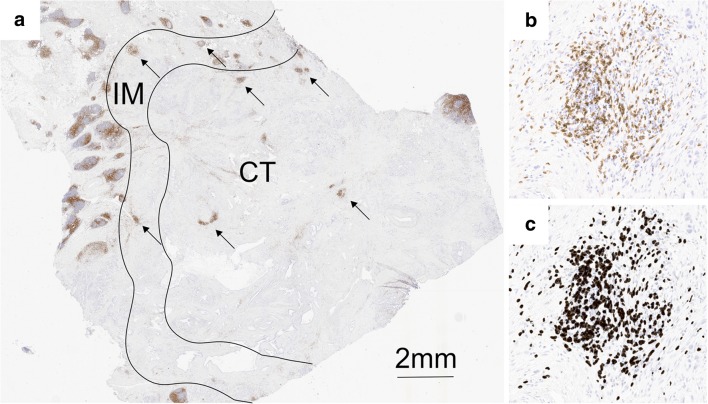
Fig. 1.
T cell infiltration in different regions of pancreatic ductal adenocarcinoma. a Image of a whole section of anti-CD3-stained tissue displaying the centre of the tumour (CT) and the invasive margin (IM). The highest densities of CD3+ T cells were found in lymphoid aggregates, localised in the IM or the CT (arrows). b A hotspot in the CT that contains a lymphoid aggregate shows numerous positive T cells and fewer scattered tumour cells. The hotspot T cell density was frequently much higher than the average whole-section T cell density. c The corresponding image analysis shows the counted cells (dark grey shading)

