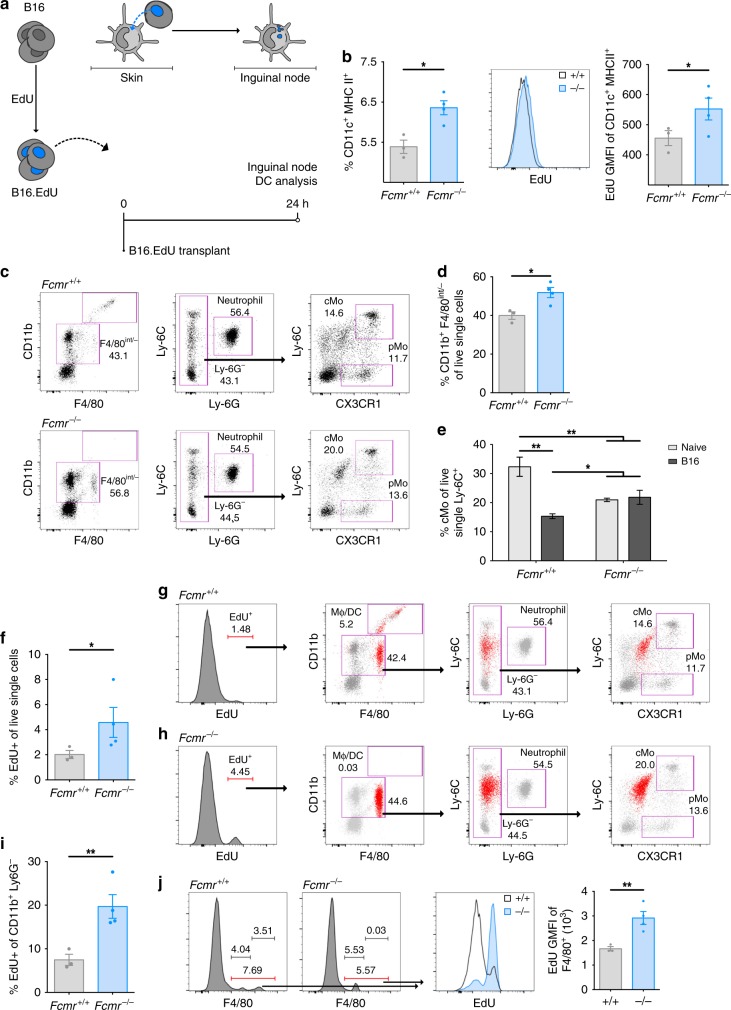
Fig. 4.
Fcmr inhibits phagocytosis to reduce cancer cell DNA uptake. a Schematic diagram showing B16 cell labeling with EdU (B16.EdU) (left), and their ventral–lateral transplantation via intradermal injection. The uptake of B16.EdU cells by skin DCs (top middle) and DC trafficking to the lymph node (top right) are also shown. The time course of the experiment is indicated (bottom right). b Left: Quantification of inguinal LN DCs in Fcmr+/+ and Fcmr−/− mice at 24 h post-B16.EdU transplant. Middle: Representative histogram showing relative EdU-positivity of these cells from Fcmr+/+ and Fcmr−/− mice. Right: GMFI quantification of EdU-positive DCs in inguinal LN. Each data point represents an individual mouse (n = 3 Fcmr+/+ and 4 Fcmr−/− mice). c Flow cytometry plots illustrating the gating strategy to identify classical monocytes (cMo) and patrolling monocytes (pMo) in PB of the Fcmr+/+ and Fcmr−/− mice in (b) at 24 h post-B16.EdU transplant. d Quantification of percentage of cMo (CD11b+ F4/80int/−) among PB myeloid cells from the mice in (c) at 24 h post-B16.EdU transplant. Each data point represents an individual mouse. e Quantification of percentage of cMo (CD11b+ F4/80int/− Ly-6G− Ly-6Chi CX3CR1+) among PB myeloid cells from naive Fcmr+/+ and Fcmr−/− mice (gray) compared to Fcmr+/+ and Fcmr−/− mice at 24 h post-B16.EdU transplant (black). Data were collected and analyzed by flow cytometry as in (c). f Quantification of total EdU-positive single live cells in PB of the Fcmr+/+ and Fcmr−/− mice in (b–e). g, h Representative flow cytometry plots back-gating (g) Fcmr+/+ and (h) Fcmr−/− total EdU-positive cells to the same populations of PB myeloid cells illustrated in (c) at 24 h post-B16.EdU transplant. The back-gated EdU-positive population is illustrated in red. i Quantification of EdU-positive MPs (CD11b+ Ly6G−) in PB of the Fcmr+/+ and Fcmr−/− mice in (b–e) at 24 h post-B16.EdU transplant. j Left: histograms illustrating total F4/80int/+ single live leukocytes in PB of Fcmr+/+ and Fcmr−/− mice. Middle: histogram showing the EdU-positive and EdU-negative populations among the cells in the left panel. Right: GMFI quantification of the data in the middle panel. Data are represented as mean ± SEM (t test; *p < 0.05; **p < 0.01; ***p < 0.001)

