Fig. 5.
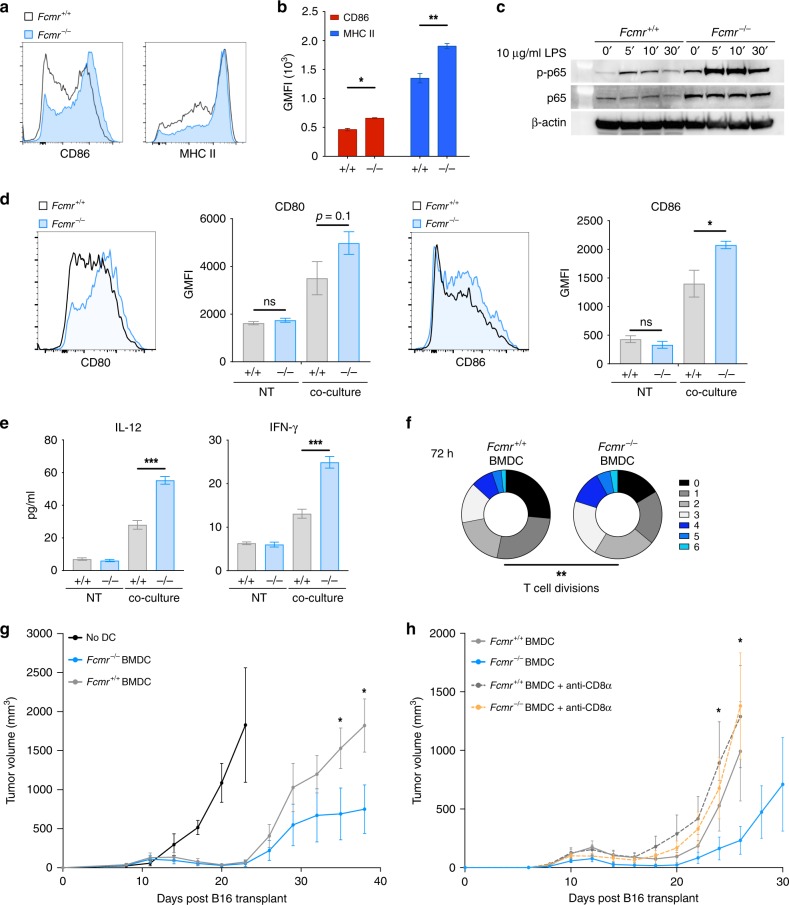
Fcmr inhibits DC maturation to impede T cell tumor immunity. a Representative histograms showing CD86 (left) and MHC II (right) expression by the CpG-stimulated Fcmr+/+ and Fcmr−/− BMDCs. b Quantification of CD86 (red) and MHC II (blue) GMFI values from the Fcmr+/+ and Fcmr−/− BMDCs. Data are pooled from three biological replicates. c Immunoblot analysis of total p65 and phospho-p65 protein levels in Fcmr+/+ (left) and Fcmr−/− (right) BMDCs that were stimulated with 10 µg/ml LPS (to engage TLR-4) for the indicated times. β-actin, loading control. Data are representative of three separate biological replicates. d Left: Representative histogram of CD80 expression on Fcmr+/+ and Fcmr−/− BMDCs that were co-cultured with moderately apoptotic B16 cells. Middle left: GMFI quantification of CD80 expression on Fcmr+/+ and Fcmr−/− BMDCs that were left untreated (NT) or co-cultured with B16 cells. Middle right: Representative histogram of CD86 expression on these same BMDCs. Right: GMFI quantification of CD86 expression on BMDCs under NT or co-culture conditions. Bar graph data are pooled from three biological replicates. e Quantification of the indicated cytokines produced by Fcmr+/+ and Fcmr−/− BMDCs under NT or co-culture conditions. Data are pooled from three biological replicates. f Quantification of T cell divisions at 72 h after co-culture with the Fcmr+/+ and Fcmr−/− BMDCs. Data are from 3 technical replicates within each of 3 biological replicates. g, h Time course of tumor growth in Fcmr+/+ mice that received ventral–lateral intradermal transplant of B16gp33 cells (2 × 10⁵) superior to the inguinal LN and were vaccinated (n = 5 mice/group) with no BMDCs, or with Fcmr+/+ or Fcmr−/− BMDCs as illustrated (Supplementary Fig. 7a). In a separate experiment, Fcmr+/+ tumor-burdened mice vaccinated with Fcmr+/+ or Fcmr−/− BMDCs were treated with an anti-CD8α T cell depleting antibody as illustrated (Supplementary Fig. 7b). Data are represented as mean ± SEM (ANOVA, t test; *p < 0.05; **p < 0.01; ***p < 0.001)

