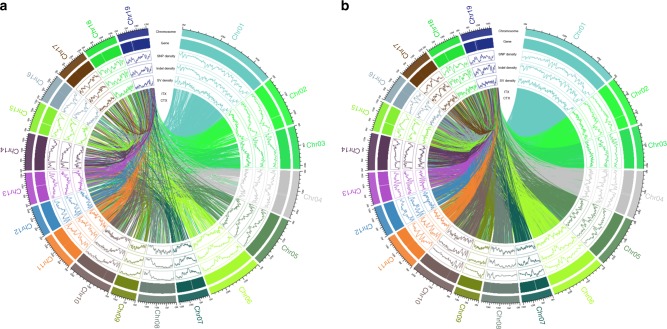
Fig. 2.
Circos plot presenting the distribution of SNPs, indels, and SVs on 19 poplar chromosomes in P. alba (a) and P. cathayana (b): outer, chromosome, gene density, SNP density, indel density, SV density, and ITX and CTX. The scales are indicated on the outer rim. The density is defined as the number of SNPs/indels/SVs per 500 Kb (excluding CTXs and ITXs from the SV density calculation). CTXs and ITXs were also presented in the middle of the circus plot. The Chromosome distributions of the genomic variation of other species are not presented

