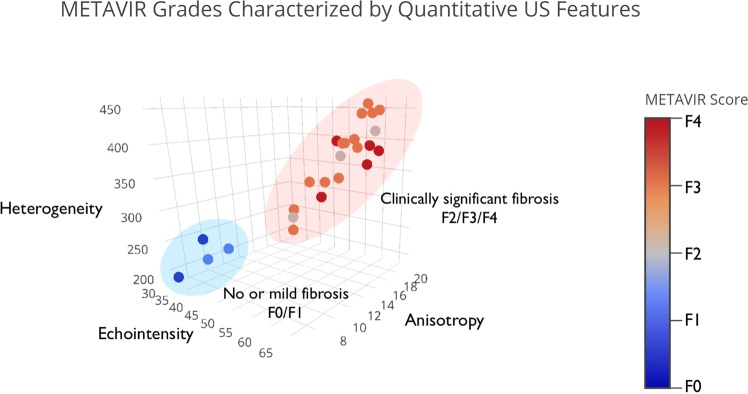
Figure 4.
Multiparametric ultrasound analyses separate METAVIR scores into two populations. In this three-dimensional plot, the mean values of echointensity, heterogeneity and anisotropy for each rat in the treated and control groups are displayed, with METAVIR score indicated by marker color and color bar. Note the clear separation of the METAVIR populations into two groups: no or mild fibrosis (F0, F1) and clinically significant fibrosis (≥F2).

