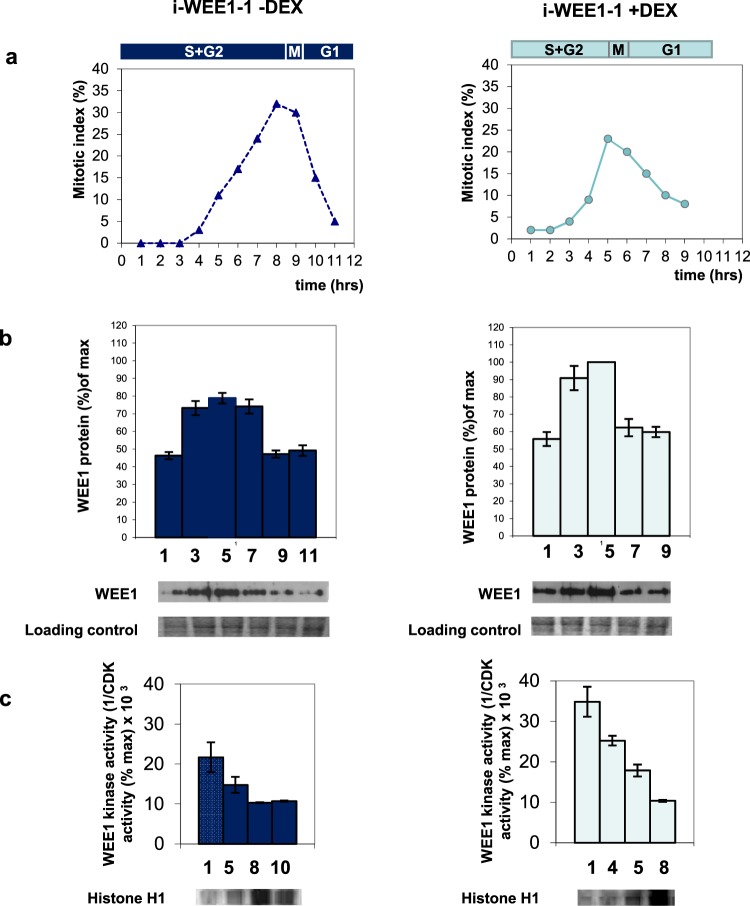
Figure 6.
WEE1 protein level and kinase activity in a synchronized transgenic N. tabacum BY2 cell culture carrying pTA7002 Arath;WEE1. Left: −DEX. Right: +DEX. (a) Mitotic index profile was calculated as the sum of prophase, anaphase, metaphase, and telophase mitotic figures as a percentage of minimum 300 cells. The corresponding cell cycle phases are shown above the mitotic index graph. (b) Immunodetection of WEE1 protein (Total WEE1 (Nicta;WEE1 + Arath;WEE1) for +DEX). Proteins were extracted from synchronized samples and subjected to Western blotting using a Nicta;WEE1 antibody. Histogram displays mean (±SE) WEE1 expression levels (n = 3). A representative Western blot and a Coomassie stain loading control are shown below the histogram. (c) WEE1 kinase inhibition assay. Histogram displays the mean (±SE) WEE1 kinase activity levels (n = 2). The incorporation of 32P was assayed by quantification of the bands on the autoradiograph and WEE1 kinase activity was expressed as the reciprocal of CDK activity (1/CDK activity (% max) × 103). A representative autoradiograph is shown below histogram.

