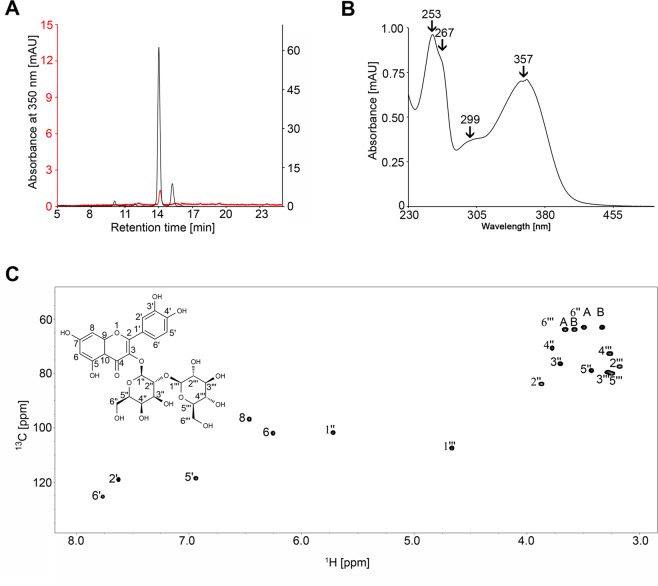
Figure 3.
Identification of the natural ligand Q3O-(Glc)-Gal. (A) RP-HPLC chromatogram of hazel pollen extract (black line) and the ligand of nCor a 1 isolated from pure SEC fractions (red line) using a C18A column. (B) UV/Vis spectrum of the ligand purified from pollen. Absorption maxima at 253 nm, 267 nm, 299 nm, and 357 nm are indicated. (C) 1H, 13C HSQC spectrum of the ligand purified from pollen in d6-DMSO. The structure is shown on the top left. A and B indicate the two different hydrogen atoms at positions 6″ and 6″′, respectively.

