Figure 6.
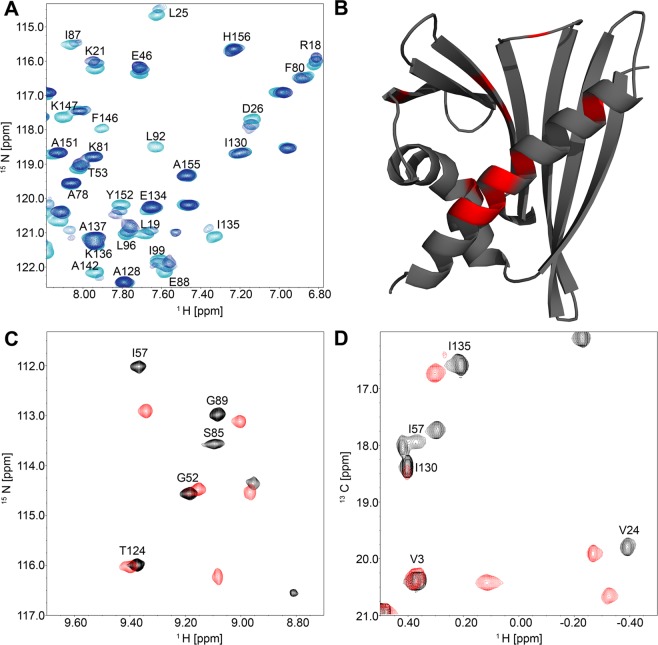
NMR titration of Cor a 1.0401 with quercetin and Q3O-(Glc)-Gal. All experiments were performed with a Bruker Avance 700 MHz spectrometer at 298 K with 60 to 100 μM Cor a 1.0401 uniformly labelled with 15N and 13C. (A) Overlay of three 1H-15N HSQC spectra of Cor a 1.0401 in the presence of increasing quercetin concentrations, from light to dark blue; ligand to protein ratio: 0, 0.5 and 1. The quercetin stock solution was prepared in d6-DMSO to obtain a final DMSO concentration of 2.2% (v/v). (B) Cartoon representation of Cor a 1.0401. The amino acids that were strongest affected by quercetin binding are highlighted in red. (C) Section of an overlay of two 1H, 15N HSQC spectra of Cor a 1.0401 in the absence (black) and presence (red) of an 8-fold excess of Q3O-(Glc)-Gal. (D) Section of an overlay of two 1H, 13C HSQC spectra of Cor a 1.0401 in the absence (black) and presence (red) of an 8-fold excess of Q3O-(Glc)-Gal.

