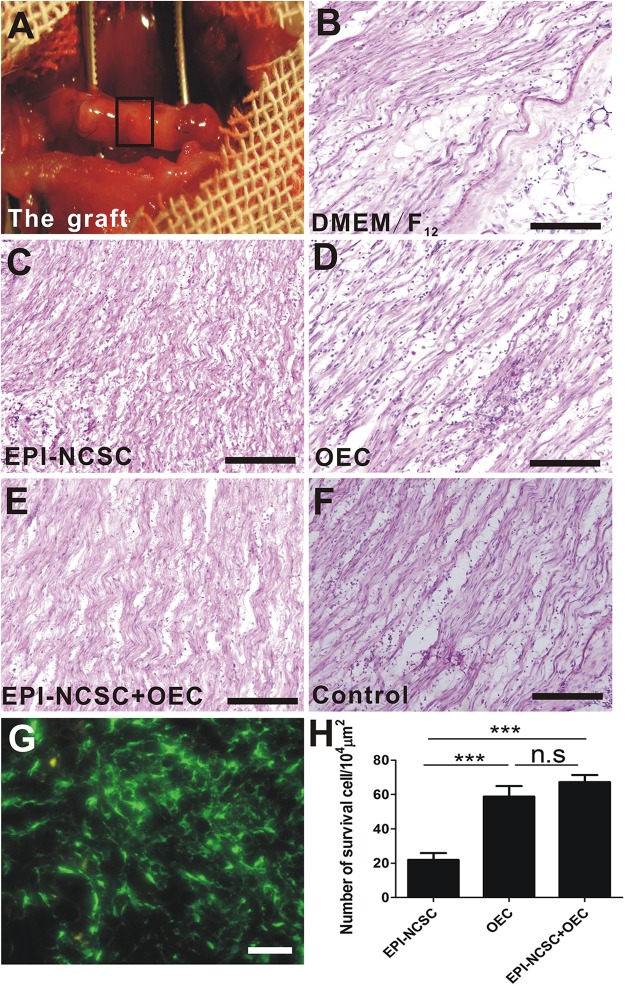
FIGURE 3.
The histological observation of the graft and cell survival in vivo 8 weeks after transplantation. (A) The graft. HE staining of longitudinal sections from (B) the DMEM/F12 group, (C) the EPI-NCSC group, (D) the OEC group, (E) the EPI-NCSC+OEC group, (F) the Control group. (G) Transplanted GFP-cells, (H) the number of surviving cells. (B–F) Scale, 100 μm; (G) Scale, 15 μm; Values are shown as mean ± SD (n = 6); ∗∗∗P < 0.001; n.s., not significant.

