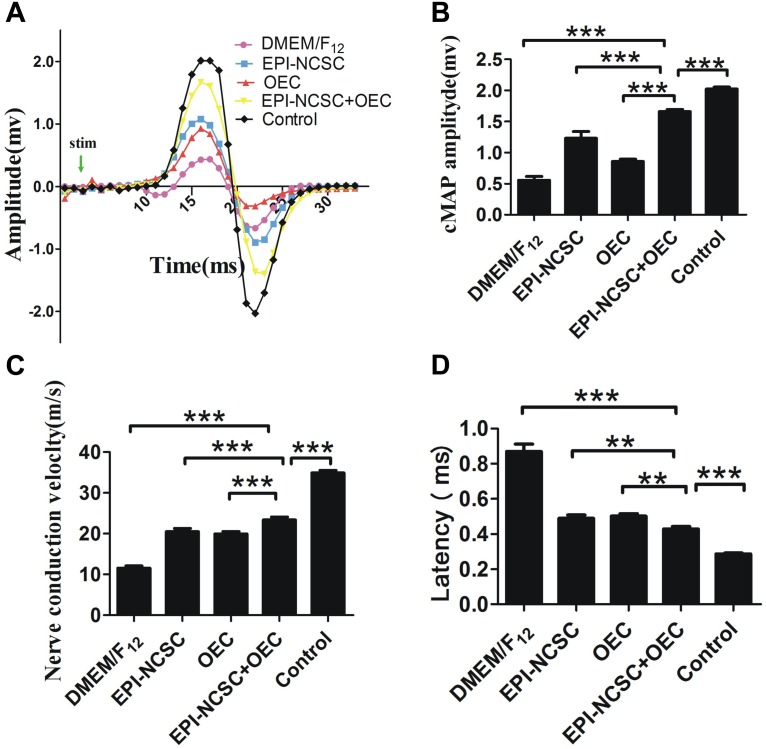
FIGURE 4.
Examination of cMAPs and NCV 8 weeks after transplantation. (A) cMAPs traces of the DMEM/F12, EPI-NCSC, OEC, EPI-NCSC+OEC, and control groups. (B) Histogram shows latency in the different groups. (C) Histogram shows NCVs in the different groups. (D) Histogram shows cMAPs in the different groups. Values are shown as mean ± SD (n = 5); ∗∗∗P < 0.001, ∗∗P < 0.01.

