FIGURE 8.
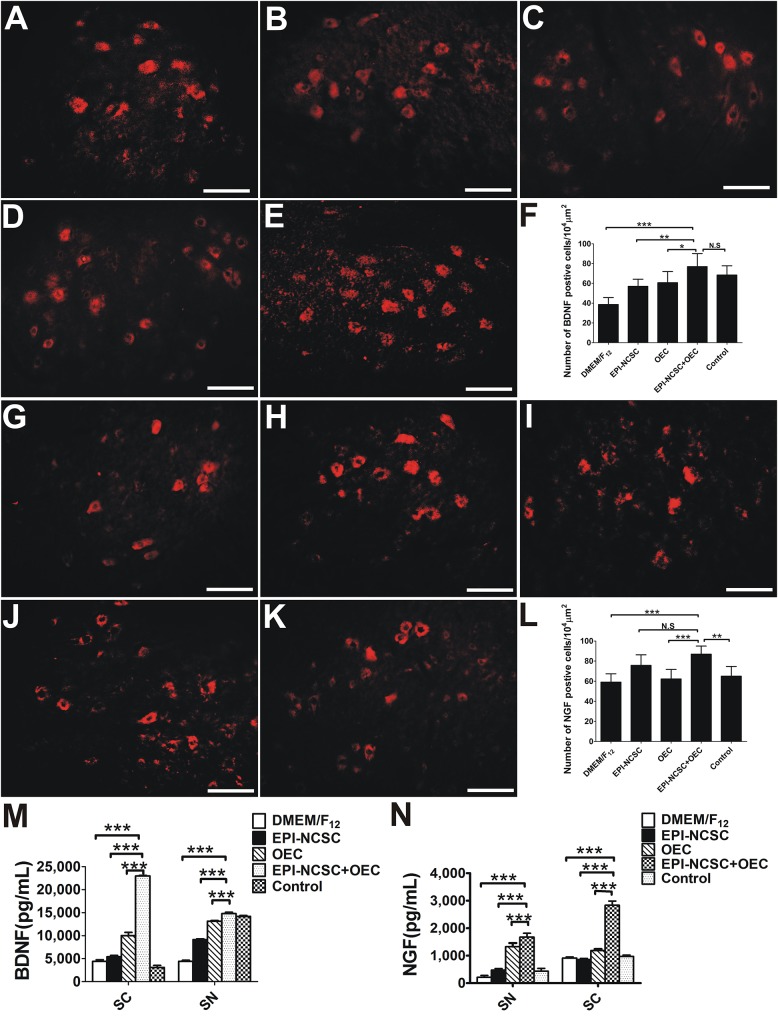
The expression analysis of BDNF and NGF 8 weeks after transplantation. Immunofluorescent staining of BDNF in (A) the DMEM/F12 group, (B) the EPI-NCSC group, (C) the OEC group, (D) the EPI-NCSC+OEC group, and (E) the Control group. (F) Histogram of the number of BDNF positive cells in each group. Immunofluorescent staining of NGF in (G) the DMEM/F12 group, (H) the EPI-NCSC group, (I) the OEC group, (J) the EPI-NCSC+OEC group, and (K) the Control group. (L) Histogram of the number of NGF positive cells in each group, (M) expression levels of BDNF in SC and SN, (N) expression levels of NGF in SC and SN. Scale, 20 μm; values are shown as mean ± SD (n = 5); N.S: no significant difference, ∗P < 0.05, ∗∗P < 0.01, ∗∗∗P < 0.001.

