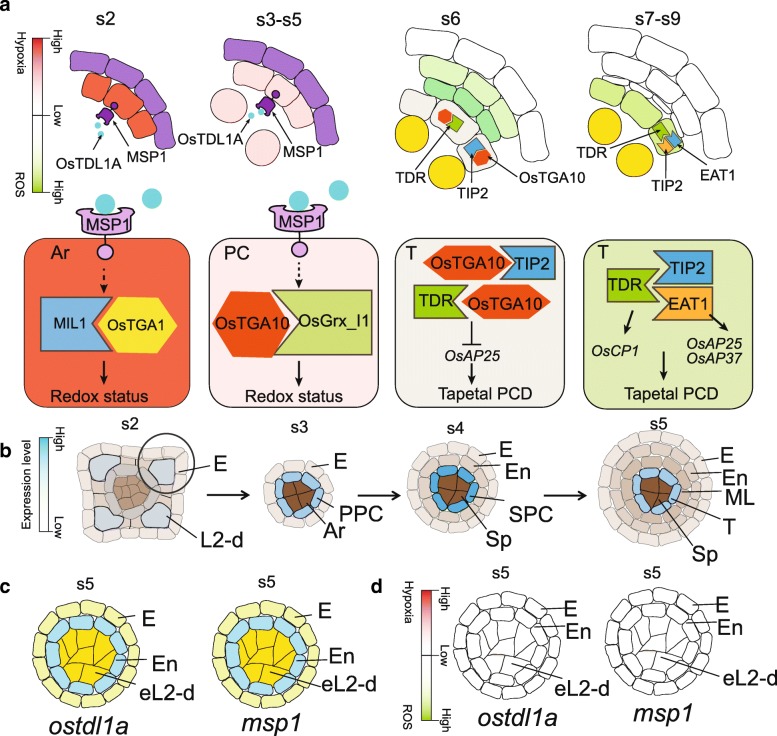
Fig. 3.
OsTDL1A-MSP1 pathway regulates anther development. a Model for protein interaction on tapetum development. b Expression pattern of OsTDL1A or MSP1 in anther. c ostdl1a and msp1 anthers with excess L2-d cells at stage 5. d ostdl1a and msp1 anthers with undetectable ROS at stage 5. Red color in a shows the gradients of hypoxia status; green color in a shows the gradients of ROS level; purple color in a shows no discussion about the redox status; white color in a and d shows undetectable level of ROS by DAB staining; yellow color in a shows germ cells; blue color in b shows the gradients of gene expression; grey color in b shows different cell layers without the expression of OsTDL1A or MSP1

