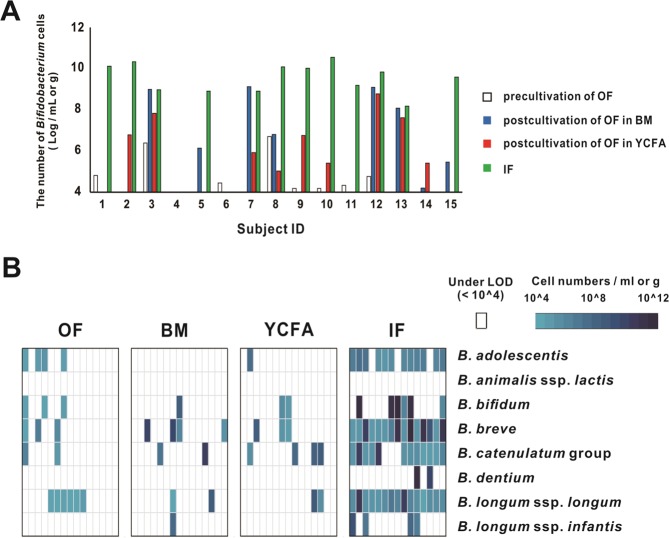
Figure 2.
Abundance and prevalence of Bifidobacterium species in OF and IF samples. (A) The abundance of Bifidobacterium was evaluated using qPCR. The limit of detection was 104 cells/mL or g. (B) A heat map showing the relative abundances of Bifidobacterium species in light to deep blue for low to high abundance, respectively. Each vertical lane in each category indicates each ID in consecutive order from left to right. Samples under the limit of detection (LOD, 104 cells/mL or g) are indicated in white. Abbreviations: precultivated neonatal oral fluid (OF), postcultivated OF in BM (BM) or YCFA (YCFA) for 48 h and infant fecal (IF) samples.

