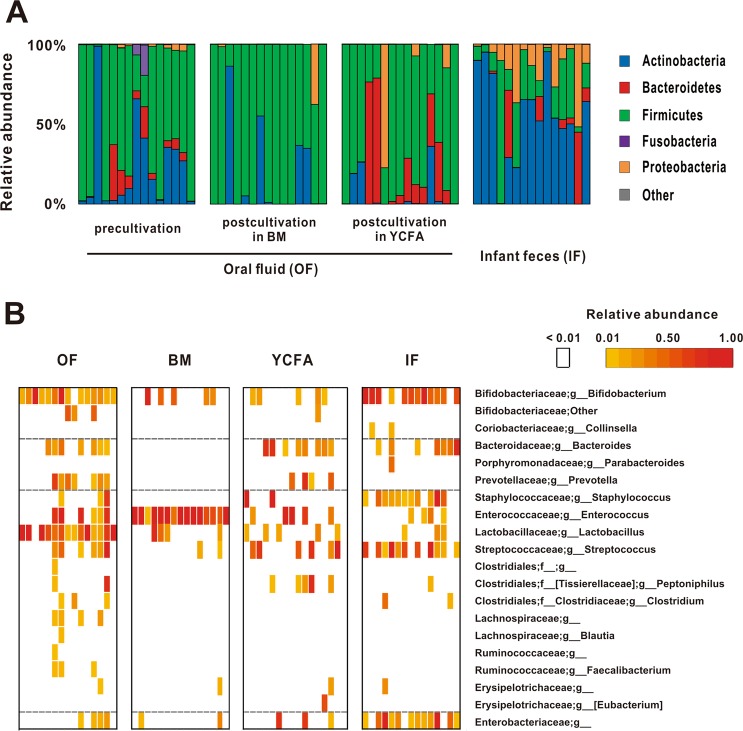
Figure 3.
Microbiotic composition of OF and IF samples. Microbiotic compositions at the phylum (A) and genus levels (B) were assessed by V3-V4 region 16S rRNA gene sequencing. Each bar in each category indicates each ID in consecutive order from left to right. (A) The microbiotic profiles at the phylum level are depicted in the bar graph. (B) In the heatmap, the relative abundances of the top 20 genera are displayed in yellow to red for low to high abundance, respectively. Abbreviations: precultivated neonatal oral fluid (OF), postcultivated OF in BM (BM) or YCFA (YCFA) for 48 h and infant fecal (IF) samples.

