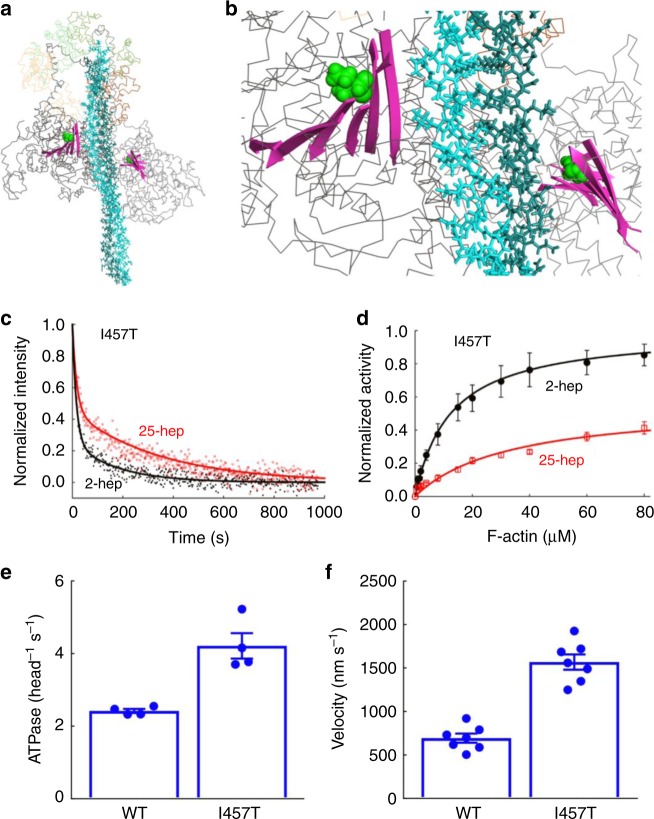
Fig. 7.
Effect of I457T mutation on HMM ATPase kinetics and in vitro motility velocity. The I457T mutation (green spheres) shown on the MS03 homology model26 of the IHM. The mutation is located on the transducer region (pink ribbons) and is not close to the proposed interfaces within the IHM. b Close up of transducer region from panel a. c Mant-nucleotide release kinetics for I457T 2-hep and 25-hep HMM. d Actin-activated ATPase activity of I457T 2-hep and 25-hep HMM. e Bar plot showing the actin-activated ATPase activity of WT and I457T 2-hep HMM. f Bar plot showing the actin gliding velocity as measured by the in vitro motility assay of WT and I457T 2-hep HMM. In panels e andand f individual data points are denoted by closed circles. c Shows representative data from one preparation of each protein. Panel d is combined data from two independent protein preparations with three experimental replicates for each preparation. For panels e and f, each point is an average of two independent experiments (each from a different myosin preparation). Error bars represent the SEM. Source data are provided as a Source Data file

