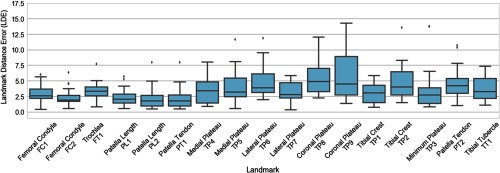
Fig. 3.
LDEs [Eq. (1a)] of the automatic algorithm compared to expert Reader 1. Each box plot shows the distribution of LDE for a given landmark (see Fig. 1, for definitions) obtained in leave-one-out validation on 24 CBCT test images. The boxes represent the interquartile range (IQR), the vertical line is the median, the whiskers extend to the extreme data points within IQR of the median, and the dots are outliers.

