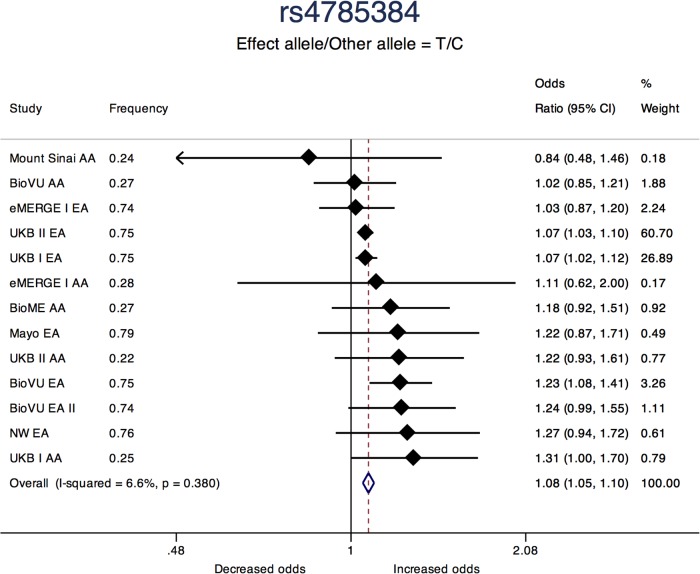
FIGURE 3.
Forest plot showing odds ratio estimates from individual studies and meta-analysis for SNP rs4785384. Meta-analyses were conducted using inverse-variance weighted fixed-effects meta-analysis to present odds ratios and 95% confidence intervals. Study column represents participating study names by strata of race. FREQ represents allele frequency for the effect allele coded in the plot.

