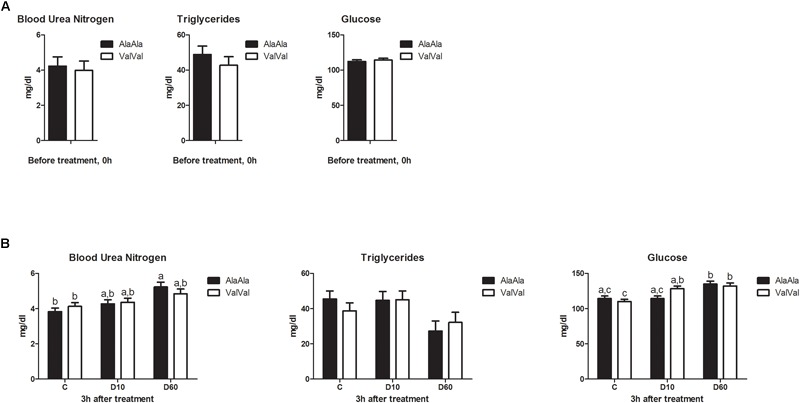
FIGURE 1.

Effect of the GRAla610Val substitution on baseline metabolite levels (A) and on metabolic responses to dexamethasone treatment (B). (A) Baseline metabolite levels in plasma before treatment (0 h). Each bar represents n = 24 per genotype group. (B) Metabolite levels in plasma 3 h after treatment. The different groups were treated with saline (C; each bar represents n = 10 per genotype group), 10 μg/kg dexamethasone (D10; each bar represents n = 8 per genotype group), or 60 μg/kg dexamethasone (D60; each bar represents n = 6 per genotype group), respectively. Results are presented as least-squares means + SEM. Bars sharing the same superscript are not significantly different at p < 0.05. For Glucose main effect of genotype × treatment interaction was significant at p < 0.05.
