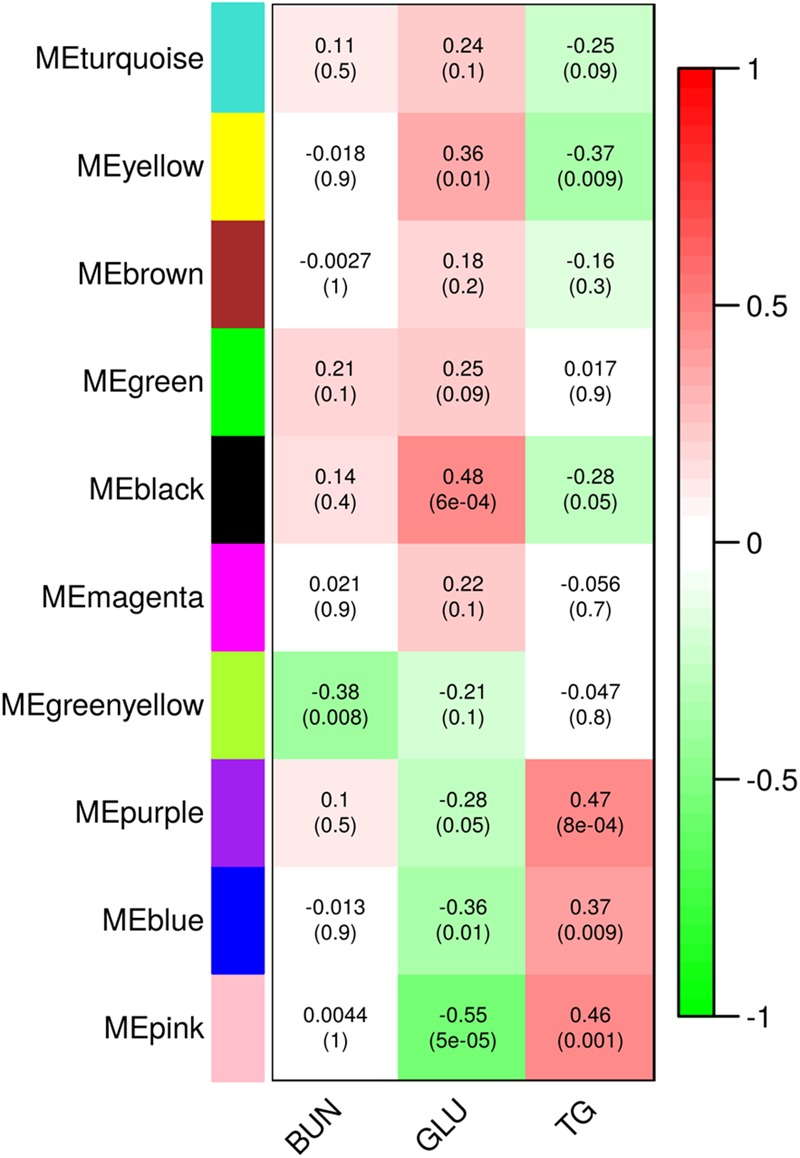
FIGURE 4.

Modules of co-regulated genes identified using weighted correlation network analysis (WGCNA). Values in the heatmap show correlation of module eigenvalues with metabolite levels in plasma 3 h following dexamethasone treatment. Upper values show Pearson correlation coefficients and lower values in parenthesis show the corresponding p-values. BUN, blood urea nitrogen; GLU, glucose; TG, triglycerides.
