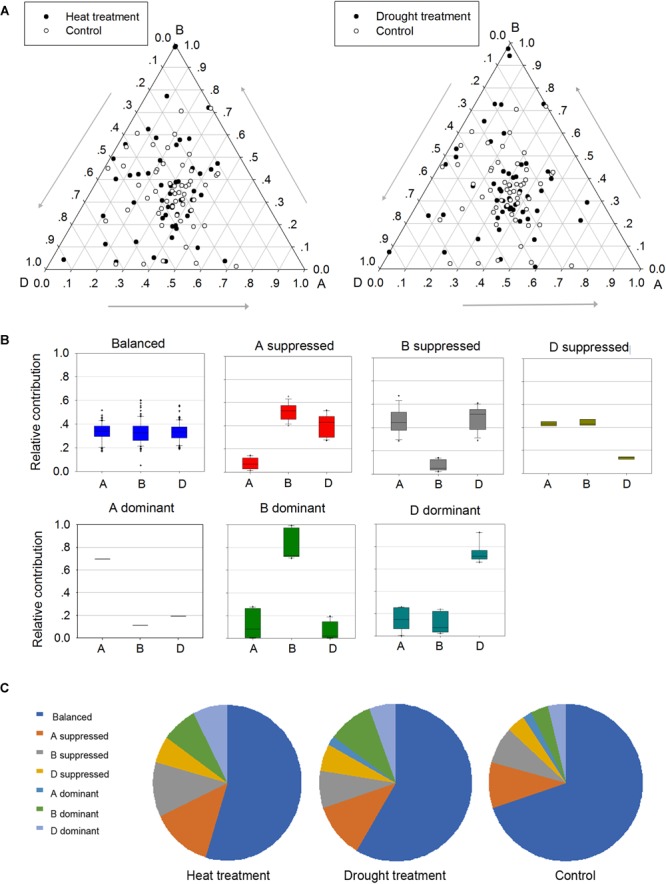
FIGURE 6.

Homoeologous expression patterns of TaPP2C genes under stress conditions. (A) Ternary plot shows relative expression abundance of TaPP2C genes under heat and drought stresses compared with non-stress condition. Each circle represents a gene triad indicating the relative contribution of each homoeolog to the overall triad expression. (B) Seven categories of homoeologous expression patterns are illustrated as box plots. (C) Pie chart represents abundance of homoeologs from each subgenome on the basis of the seven categories.
