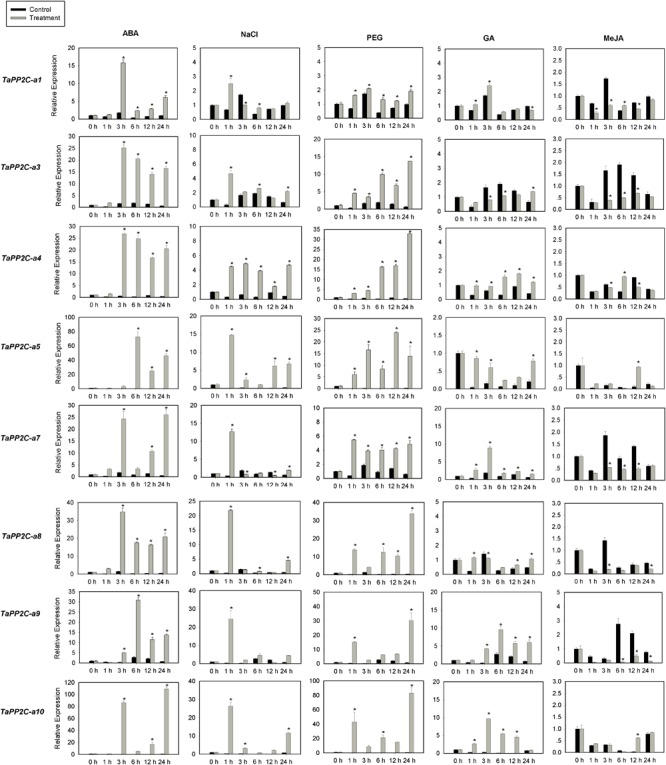
FIGURE 7.

Quantitative real-time PCR analysis of group A TaPP2C genes in response to ABA, NaCl, PEG, GA and MeJA treatments. Error bars represent the S.D. of three independent replicates. An asterisk indicates significant difference between the stress conditions and the control condition (∗P < 0.05, Tukey test).
