FIGURE 2.

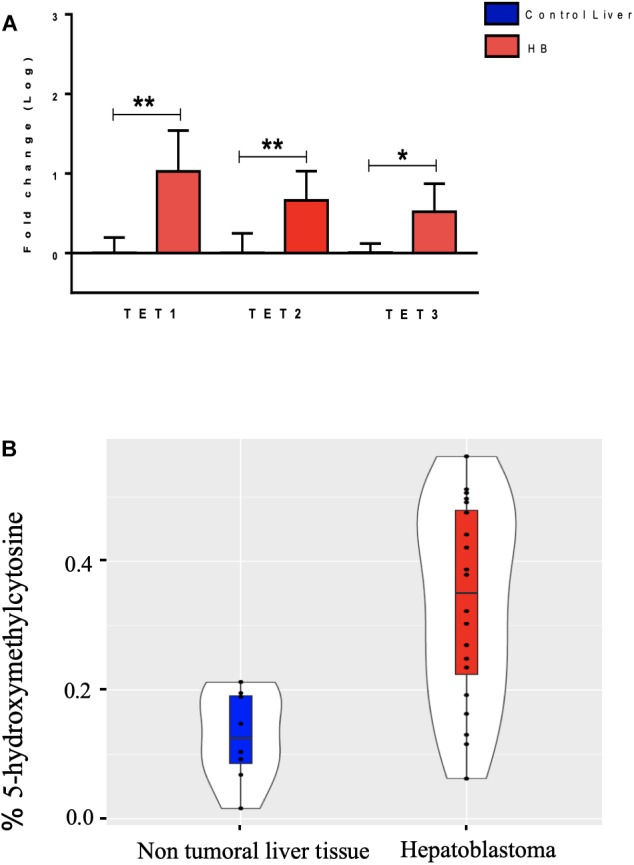
Analysis of DNA hydroxymethylation in hepatoblastomas. (A) Expression analysis of DNA hydroxymethylation genes in hepatoblastomas. Upregulation of three genes of the TET family in 19 tumor samples compared with eight non-tumoral liver samples as evidenced by RT-qPCR. Control Liver: non-tumoral liver tissue samples; HB: hepatoblastoma samples. Endogenous gene: 18S rRNA. The Kruskal Wallis post hoc Dunn test with Bonferroni correction was used for statistical analysis. ∗p-value < 0.05; ∗∗p-value < 0.01. (B) 5hmC global level enrichment in hepatoblastoma samples. Violin plots showing the overall level of 5hmC in percentage in hepatoblastomas samples (red) and non-tumoral liver tissues (blue). Hepatoblastoma samples mean: 0.33%, SD: 0.15; non-tumoral liver tissue samples mean: 0.13%; SD: 0.07. The t-test was used for the statistical analysis. p-value: 4.2e-05.
