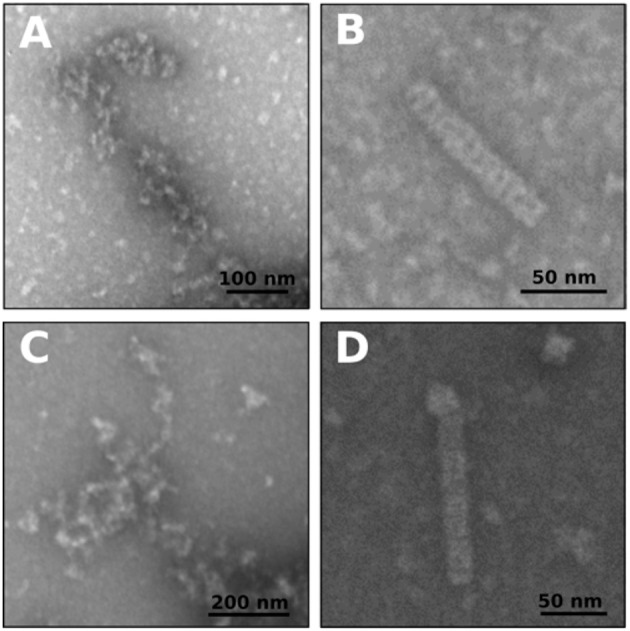
Figure 2.

Negative staining electron microscopy of polymers of EcFtsZ and BsFtsZ with dNAK 4. (A,B) Electron microphotographs of filaments after depolymerization of GTP induced polymers of EcFtsZ and BsFtsZ, respectively, with 32 μM of dNAK 4. (C,D) Electron microphotographs of GDP induced polymers of EcFtsZ and BsFtsZ, respectively, with 32 μM of dNAK 4. In each case the protein concentration was 12.5 μM in a buffer containing 50 mM Hepes pH 7.3, 50 mM KCl, 10 mM MgCl2, and 1 mM GTP (and PK/PEP system) (A,B) or with 2 mM GDP (C,D). A size bar is included in each figure.
