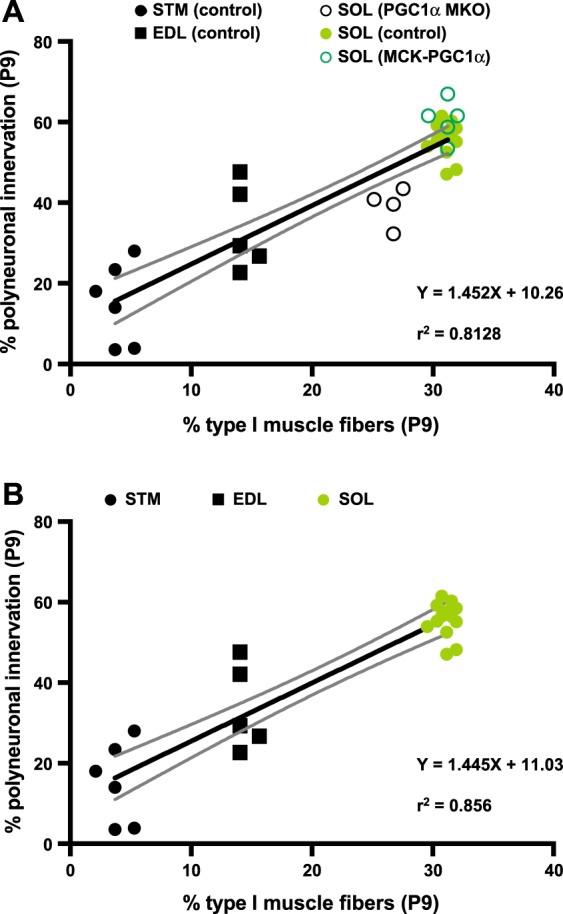
Figure 3.

A linear regression of the frequency of polyneuronally innervated NMJs on the abundance of type I muscle fibers. (A) The fraction of NMJs that remain polyneuronally innervated at P9 for control muscles – EDL (n = 5), SOL (n = 14), STM (n = 6) – as well as PGC1α MKO SOL (n = 4) and MCK-PGC1α SOL (n = 5) were regressed on the mean type I muscle fiber frequency for each muscle. The analysis revealed a close relationship (r2 = 0.8128) with the best-fit line slope (1.452 ± 0.1232; solid black line) that deviates significantly from zero (p < 0.0001). (B) An identical analysis using only the control EDL, SOL and STM muscles similarly revealed a close relationship (r2 = 0.856) with the best-fit line slope (1.445 ± 0.1236; solid black line) that deviates significantly from zero (p < 0.0001). The confidence bands (the two curved gray lines) are 95% sure to enclose the true best-fit linear regression line.
