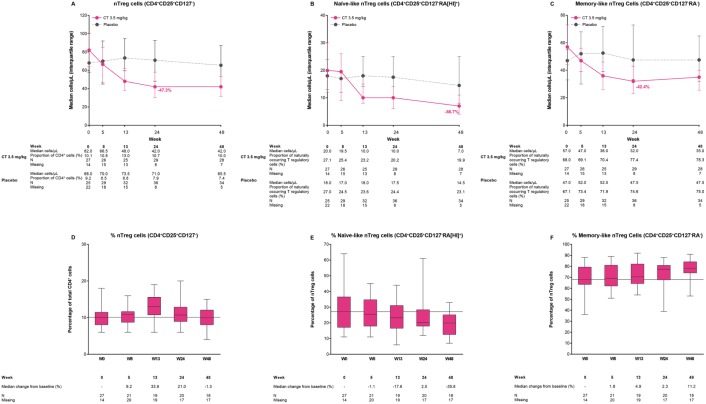
Figure 5.
Median counts over time for T-cell subtypes: (A) naturally occurring T-regulatory (nTreg) cells (CD4+CD25+CD127−); (B) naïve-like nTreg cells (CD4+CD25+CD127−RA(HI)+); and (C) memory-like nTreg cells (CD4+CD25+CD127−RA−); proportions of lymphocyte subtypes relative to CD4+ cells for (D) naturally occurring T-regulatory (nTreg) cells (CD4+CD25+CD127−); and relative to (E) nTreg cells for naïve-like nTreg cells (CD4+CD25+CD127−RA(HI)+); and (F) memory-like nTreg cells (CD4+CD25+CD127−RA−) in the ORACLE-MS study.
In (A)–(C), the lower and upper error bars indicate first and third quartile values. In (D)–(F), the horizontal line indicates median values, lower and upper box edges indicate Q1 and Q3 values (data in (D) expressed as a percentage of total CD4+ cell counts; data in (E) and (F) expressed as percentage of nTreg cell counts). Values in (D) indicate percentage changes from week 0 in the proportion of cells relative to total CD4+ cells. Values shown in (E) and (F) indicate percentage change from week 0 in the proportion of cell types relative to total nTregs. There was an increase in memory-like nTreg cells towards the end of sampling.

