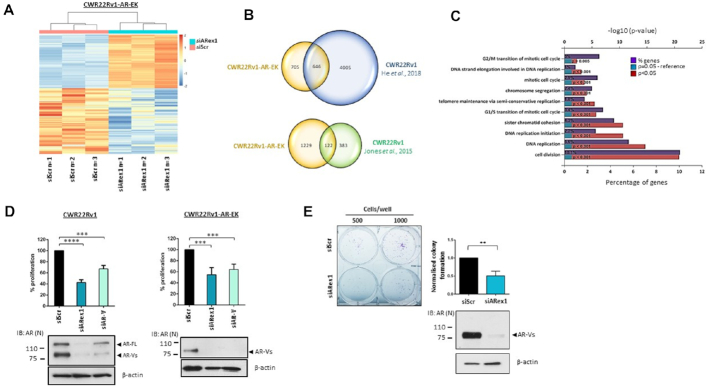
Figure 3.
AR-Vs drive proliferative and survival signals in CWR22Rv1-AR-EK cells. (A) Heatmap of the log transformed normalised expression of genes up- and down-regulated in triplicate CWR22Rv1-AR-EK cells subject to either control (siScr) or AR-V (siARex1) depletion. The data is row-scaled with red and blue representing relative higher and lower expression, respectively. (B) Venn diagrams showing overlap between AR-V-target genes in CWR22Rv1-AR-EK cells and those derived from CWR22Rv1 parental cells depleted of AR-Vs (He et al., 2018 & Jones et al., 2015). (C) Functional annotation of AR-V regulated genes in the CWR22Rv1-AR-EK cell line demonstrates that AR-Vs control cell cycle and mitosis-related pathways. The % of genes identified in each pathway are shown alongside statistical significance of genes featuring in these pathways. (D) CWR22Rv1 and CWR22Rv1-AR-EK cells were grown in steroid-depleted media and subject to transfection with either control (siScr), FL-AR/AR-V-targeting (siARex1) or AR-V-targeting (siAR-V) siRNAs for 96 hours before analysis of cell proliferation by SRB assays. Data represents the average of three independent experiments ± SD (*** and **** represent P< 0.001 and 0.0001, respectively as determined using one-way ANOVA). Lower immunoblotting panels indicate successful depletion of FL-AR and AR-Vs using siARex1 and discriminate knockdown of AR-Vs by siAR-V using an anti-AR antibody. (E) Cells transfected as in (D) were subject to clonogenic assays for 2 weeks before quantification. Representative colony numbers are shown in the left panel. Data in the right panel represents the average of three independent experiments ± SD (** represents P< 0.01 as determined using a two-tailed Student's t-test). Lower panel immunoblot image indicates successful depletion of AR-Vs using an N-terminal AR-binding antibody.

