
Figure 3.
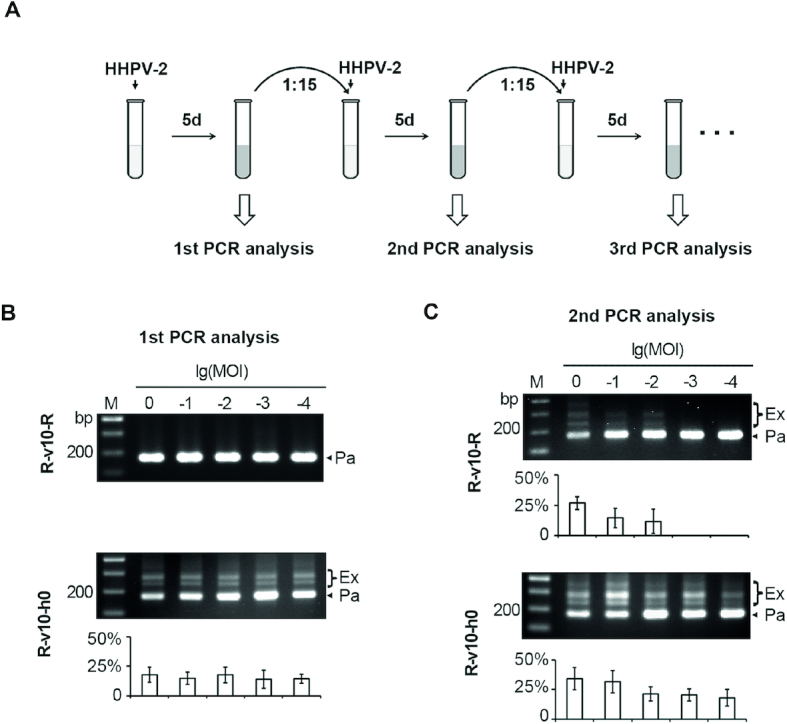
Primed adaptation became more evident when 3′ handle was deleted. (A) Schematic depiction of the procedure to monitor the v10-primed adaptation to HHPV-2. The mid-log culture of Sp1d cells expressing v10-crRNA was inoculated into fresh medium with HHPV-2 addition (MOI ranging from 1:1 to 1:10000). After 5-day culturing, expansion of the Sp1d CRISPR was monitored by PCR analysis (see Figure 2A for primer information). Sub-inoculation and reinfection were performed until Sp1d expansion was detected. The first (B) and the second (C) PCR analysis of spacer acquisition in Sp1d cells expressing R-v10-R or R-v10-h0. The log values of MOI are indicated. M, dsDNA size marker. The plots show the percentage of the intensity of ‘expanded’ bands (Ex/(Ex+Pa)) for each gel lane. Error bars indicate the SD calculated from three independent replicates.