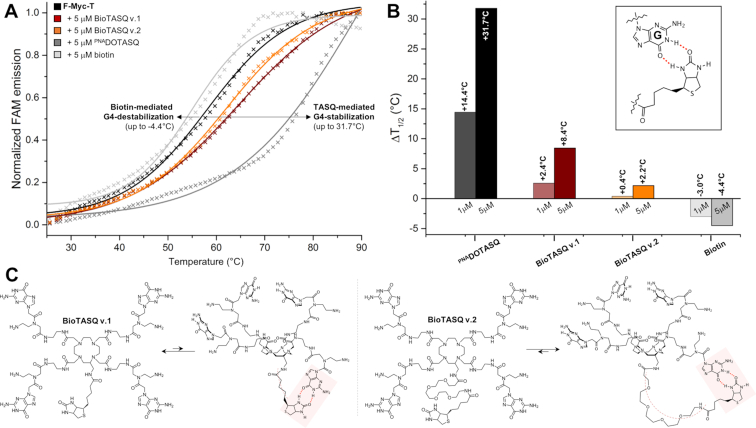
Figure 3.
(A) FRET-melting results obtained with F-myc-T (0.2 μM, black line) and ligands (5 μM), either BioTASQ v.1 (brown line), BioTASQ v.2 (orange line), PNADOTASQ (dark grey line) or biotin (grey line). (B) Summary of ΔT1/2 values obtained with F-myc-T (0.2 μM) and increasing amounts of ligands (1 and 5 μM), either BioTASQ v.1, BioTASQ v.2, PNADOTASQ or biotin; inset: a schematic representation of the possible biotin/guanine association. (C) Schematic representation of the biotin/guanine interactions that could take place intramolecularly within the structure of BioTASQ v.1 (left panel) or BioTASQ v.2 (right panel).

