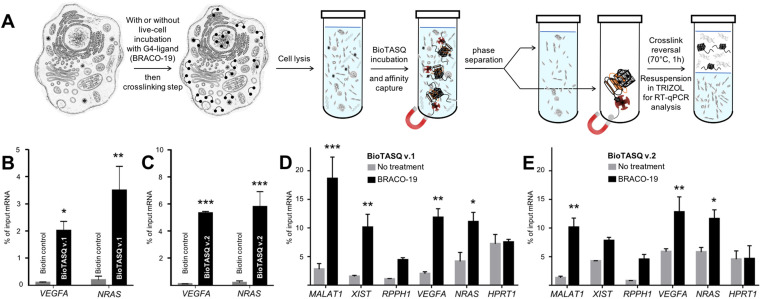
Figure 5.
(A) Schematic representation of the G4RP-RT-qPCR protocol. (B,C) G4RP signals of biotin control versus BioTASQ v.1 (B) and BioTASQ v.2 (C) through RT-qPCR quantification of VEGFA and NRAS mRNA levels in untreated MCF7 cells. Three biological replicates were used for the quantifications. (D,E) G4RP signals obtained with BioTASQ v.1 (D) and BioTASQ v.2 (E) quantified with RT-qPCR measurements of MALAT1, XIST, RPPH1, VEGFA, NRAS and HPRT1 RNA levels in untreated (grey bars) or BRACO-19-treated MCF7 cells (black bars). Values are normalized to their individual input control used for the BioTASQ pull-down. Two-way ANOVA was performed against No Rx control. *P < 0.05, **P < .01, ***P < 0.001. Experiments were conducted with three biological replicates. Error bars represent standard error of the mean (SEM).

