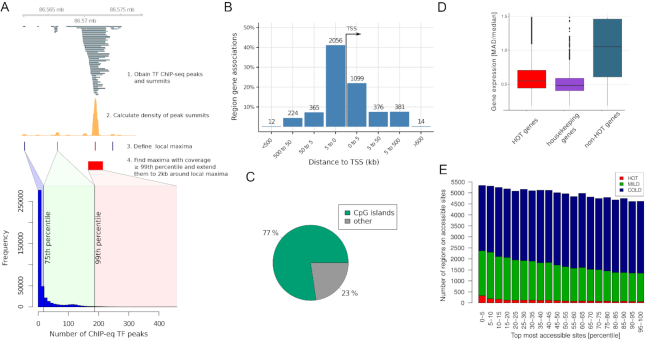
Figure 1.
Features of HOT regions. (A) Schematic workflow of HOT region definition. The barplot indicates number of ChIP-seq peaks in HOT (red), MILD (green) and COLD (blue) regions. (B) HOT regions are located mostly close to transcription start sites and are promoter associated. The figure shows binned orientation and distance between HOT regions and the nearest genes. Associations precisely at 0 refers to the transcription start site of the nearest gene. (C) Most HOT regions overlap with CpG islands. (D) Gene expression variation on HOT regions. Variation of expression of genes associated with HOT regions is as low as housekeeping genes, and expression is less variable than non-HOT genes. Median absolute deviation (MAD) and median was calculated for each gene across 57 human cell lines and tissues from the Roadmap Epigenomics database. (E) Chromatin accessibility on HOT regions. DNase-seq peak set from K562 cell line was ranked according to their signal value. On X axis are percentiles of DNA-seq peaks according to their ranks, on Y axis percent of HOT regions that overlap DNA-seq peaks.

