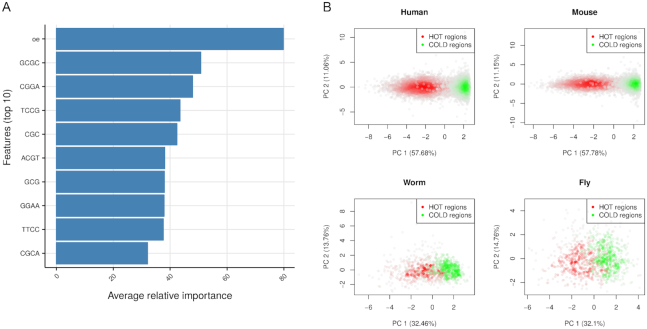
Figure 2.
k-mer properties of HOT regions. (A) Top 10 features ordered in relative importance averaged across species. Importance scores are scaled to 0–100 scale for each species then averaged. Top feature [oe] means observed/expected ratio for CpG dinucleotides. (B) Principal component analysis using top 10 features shown in A. PCA is carried out for human, mouse, worm and fly separately. Scatter plots using first two principal components are shown, each dot represent HOT and COLD regions. The scatter plot is colored based on density of points, the more dense the points the darker the color.

