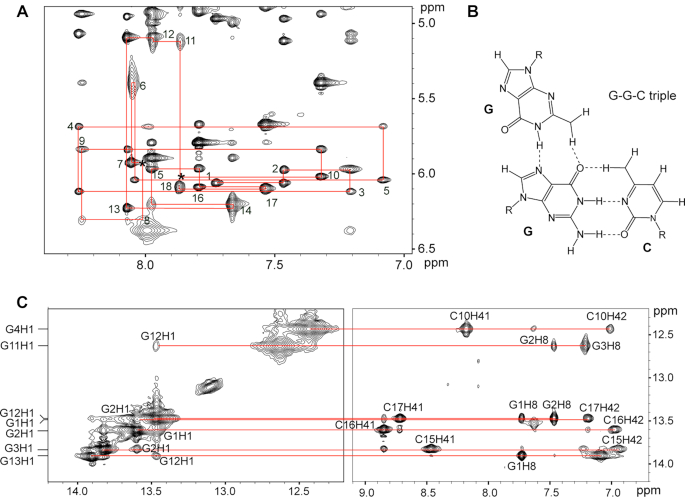
Figure 2.
Spectra of the OBAwt OTA complex in phosphate buffer containing Mg2+. (A) NOESY spectra showing H8/H6-H1′ connectivity in D2O at 288 K (mixing time, 300 ms). Intraresidue H6/H8-H1′ NOE cross-peaks are labeled. Locations mark with an asterisk (*) represent unobserved cross peaks. (B) Schematic representation of G–G–C triple. (C) NOESY spectra showing H1 protons assignments H2O solvent at 288 K (mixing time, 100 ms).

