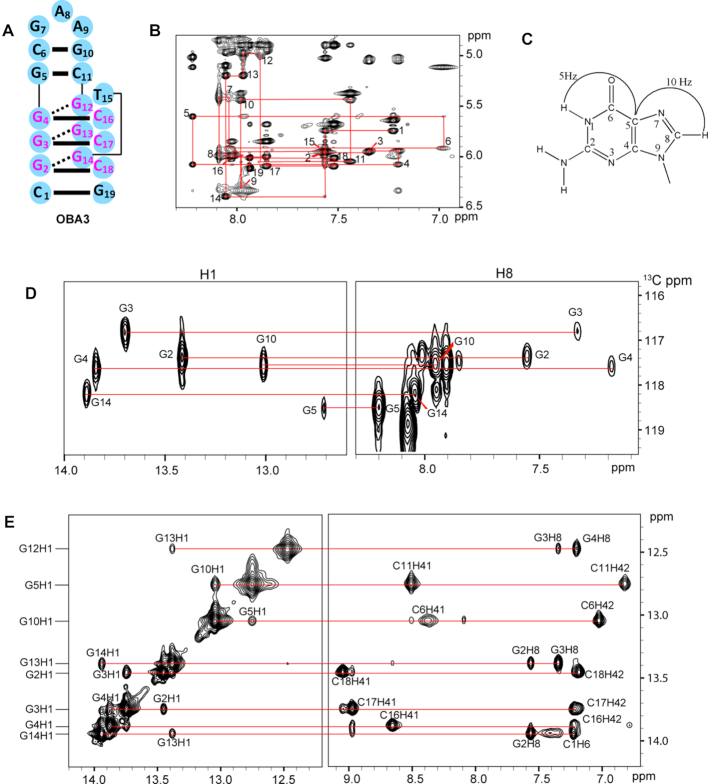
Figure 4.
NMR spectra of the OBA3─OTA complex in phosphate buffer containing Mg2+. (A) The sequence of OBA3. The Watson-Crick and Hoogsteen hydrogen bonds are represented by solid- and dashed- bars, respectively. (B) NOESY spectra showing H8/H6-H1′ connectivity of OBA3 in D2O at 288K (mixing time, 300 ms). Intraresidue H6/H8-H1′ NOE cross-peaks are labeled with residue numbers. Peaks labeled (*) are not observed. (C) A schematic indicating long-range J-couplings between imino and H8 protons via 13C5 within the guanosine base. (D) H1 and H8 proton assignments by through-bond correlations between imino and H8 protons via 13C5 shown in (C) at natural abundance at 298 K. (E) NOESY spectra showing H1 protons assignments of OBA3 in H2O at 288 K (mixing time, 300 ms).

