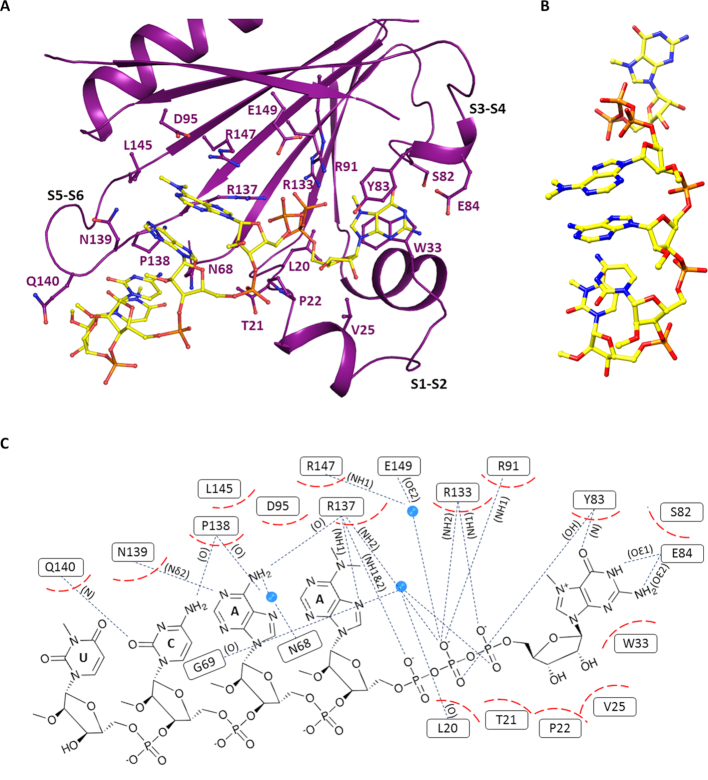
Figure 4.
T. cruzi EIF4E5 cap recognition site. (A) Representation of the cap-4 binding site. Residues involved in the interaction with cap-4 are shown in sticks and labeled. The regions connecting β1–β2, β3–β4 and β5–β6 strands (S1–S2, S3–S4 and S5–S6) are indicated. (B) Three-dimensional structure of cap-4 evidencing the AACU base stacking. (C) Schematic representation showing the cap-4-TcEIF4E5 interactions in detail. Hydrophobic interactions are represented in dashed red and hydrogen bonds in blue dotted lines. The atoms involved in the hydrogen bonds are indicated in parentheses. Water molecules are represented as blue spheres.

