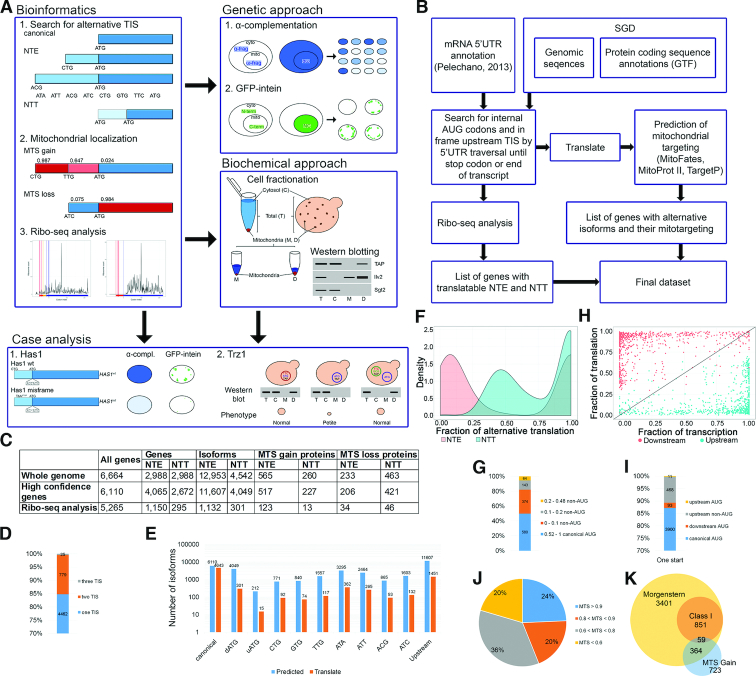
Figure 1.
Alternative initiation start sites (aTIS) are common in yeast cells. (A) Outline of the in silico (left panel) and in vivo (right panel) pipeline used in this work. Alternative protein isoforms, which are translated from the listed non-AUG or upstream AUG (uAUG) codons for NTE and downstream AUG (dAUG) codons for NTT, are identified by the algorithm depicted in (B). This is followed by MTS prediction for each isoform using MitoProt II, TargetP and MitoFates, and ribosome profiling (Ribo-seq) analysis. Mitochondrial localization of selected mitochondria-targeted NTE candidates is validated using two in vivo approaches, followed by detailed case studies (bottom panel). (C) Bioinformatics screen results. The columns contain number of genes included in the screen and genes/proteins resulting from the screen as follows: NTE/NTT-generating genes, NTE/NTT-containing isoforms, NTE/NTT proteins with NTE/NTT-MTS gain and NTE/NTT-MTS loss (see text). The rows refer to all annotated ORFs in SGD, high-confident ORFs with merged, deleted or dubious ORFs filtered out and ORFs utilised in translation according to the Ribo-seq analysis. (D) Number of translation start sites (TIS) observed in ribosome profiling analysis. (E) Number of predicted and utilized start codons, canonical AUG, dAUG, uAUG, upstream non-AUG and all upstream TIS. (F) Density plot of relative translation level from alternative TIS. Fraction of upstream (NTE, red color) and downstream (NTT, blue color) translation is calculated for each gene that utilizes at least one NTE as a ratio of RPKM upstream/downstream of the canonical TIS. Only NTE proximal to the canonical TIS and the first 50 codons of the CDS (coding sequence) are considered to account for the ‘codon ramp’ that causes artificially higher ribosome density at CDS 5′ ends. (G) Distribution of the relative translation level from canonical and non-AUG codons for NTE proteins with one additional aTIS. (H) Scatter plot of transcript and translation level relative to absolute transcript and translation level of each gene. Fraction of translation is calculated as in (F); fraction of transcription represents a ratio of mTIFs (major transcript isoform; (43)) encompassing given isoform to the total number of mTIFs for a given gene. Red and blue dots correspond to downstream and upstream protein isoforms, respectively. Transcript isoform is considered to contain particular TIS when it covers at least 5 nucleotides upstream of the TIS. (I) Efficiency of codon usage for proteins translated from one TIS, which are supported by the Ribo-seq analysis. (J) MTS probability of mitochondria-targeted N-terminally extended (MT-NTE) proteins. The numbers show the maximal MTS value, predicted using MitoProt II, TargetP or MitoFates. (K) Venn diagram depicting the number of mitochondria-associatedand high-confidence mitochondrial proteins according to (10) and ‘MTS gain’ proteins identified in this study.

