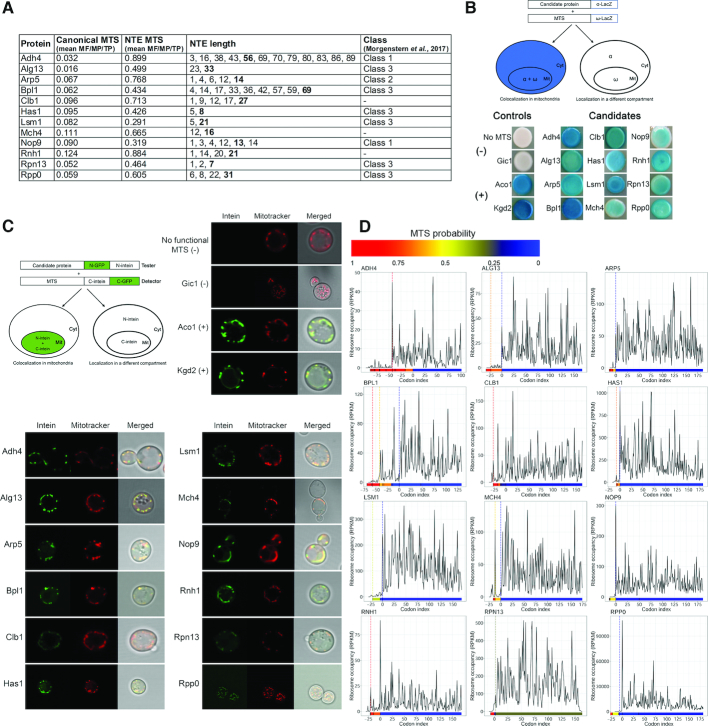
Figure 2.
Mitochondrial localization of selected candidates tested by genetic assays. (A) List of tested candidates. Canonical MTS and NTE MTS columns show the predicted value of the MTS (mean of scores predicted by MitoProt II, TargetP and MitoFates) when the protein is translated from the major AUG or alternative non-AUG codon, respectively. NTE length represents the length of N-terminal extensions of putative non-AUG initiated isoforms, numbers in bold denote the isoform with the highest MTS probability score, shown in NTE MTS column). Class refers to classification of proteins in the mitochondrial proteome (10). (B) Representative α-complementation assays with 12 candidate proteins. Schematic illustration of the α-complementation assay (top left panel). Co-localization in the same compartment of the candidate protein fused to the α fragment of β-galactosidase with its ω fragment results in blue colonies (left panel), whereas lack of co-localization gives white colonies (right panel). Cyt, cytosol; Mit, mitochondria. Kgd2 and Aco1 were used as positive mitochondrial controls, while the cytosolic α fragment w/o functional MTS and a lacZα fusion variant of the nuclear/cytosolic protein Gic1 served as negative controls. (C) Split-Intein-GFP subcellular localization assay of the representative 12 screened proteinslisted in (A). Schematic illustration of the Split-Intein-GFP assay (top left panel). The candidate protein, expressed from a strong promoter, and fused to the HA-tagged N-terminus of GFP, followed by the N-intein domain of a split intein, is co-expressed with a mitochondrial reporter containing a cleavable MTS followed by the HA-tagged C-intein domain of a split intein and the C-terminal domain of GFP. A functional MTS N-terminally appended to the tester-GFP-N-intein will target the tester to mitochondria and allow for reconstitution of GFP fluorescence, visualized by fluorescence microscopy, even when only a small fraction of the candidate protein is localized to mitochondria (right panel). Kgd2 and Aco1 were used as positive mitochondrial controls, while the N-intein w/o MTS and Gic1 served as negative controls. Mitochondria (red) were counterstained with Mitotracker. (D) Ribosome density A-site profiles along mRNAs coding for tested proteins. Shown is the region spanning codons from –75 to +175 upstream or downstream of annotated AUG codon, respectively. Every potential upstream start codon is indicated with a vertical line in a color corresponding to the heatmap (below each graph), which represents MTS values predicted by MitoProt II for each isoform.

