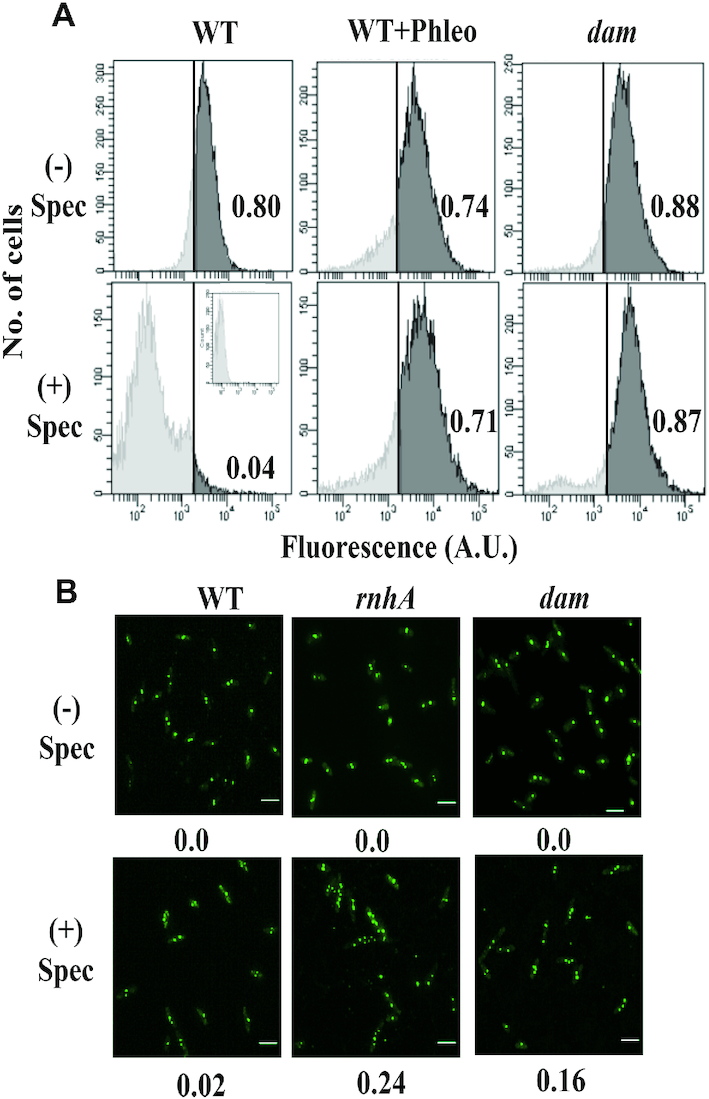
Figure 1.

cSDR in dam mutants. (A) Analysis by flow cytometry, as described (52), of DNA synthesis in cultures of (i) parental (WT) strain GJ18609, (ii) WT with phleomycin (WT+Phleo) at 1 μg/ml, and (iii) the isogenic dam mutant GJ16494 (dam), without (–) or with (+) treatment with spectinomycin (Spec). In each panel, the proportion (of the total) of cells in which the fluorescence value exceeded the gating threshold (vertical line) is given at right. Inset within bottom left panel depicts fluorescence in cells exposed to neither EdU nor Alexa Fluor 488 (that is, autofluorescence). (B) Fluorescence microscopy for detection of ParB::YGFP-parS foci in cells from cultures of plasmid pAD16-bearing derivatives of parental (WT) strain GJ15830 and its isogenic rnhA or dam mutants (GJ15831 and GJ15832, respectively) without (–) or with (+) treatment with Spec. Beneath each panel, the proportion of cells with >2 foci is indicated (minimum of 300 cells examined). Scale bar, 3 μm.
