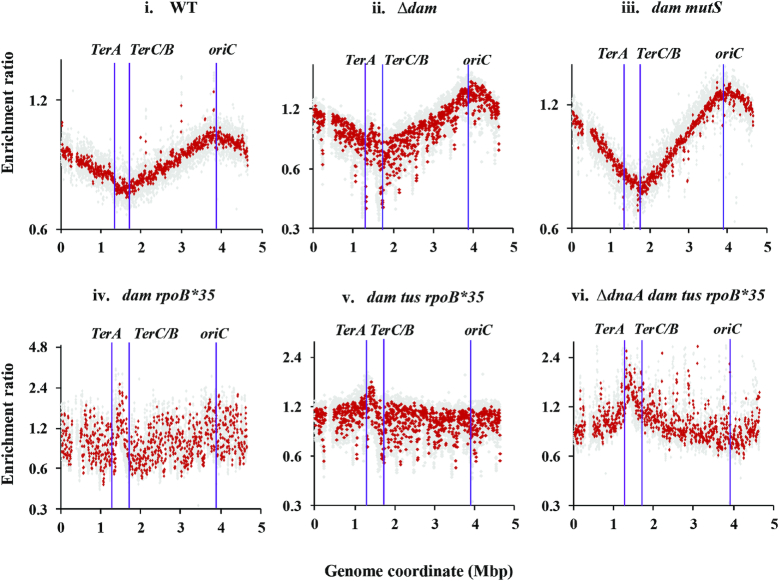
Figure 4.
Copy number analysis by deep sequencing in dam mutants. From the sequencing reads for the indicated strains (grown to log phase in LB at 37°C), copy number distributions for 1-kb (gray) and overlapping 10-kb (red) intervals have been plotted on semi-log graphs as enrichment ratios across the genome, as described in the text and Supplementary Text. Positions of oriC, TerA and TerC/B are marked. The gap at around 0.3 Mb in each of the distribution plots corresponds to the argF-lac deletion present in the strains. Isogenic strains displayed in the different panels (their relevant genotypes indicated on top of each panel) are: i, GJ13519; ii, GJ18617; iii, GJ18618; iv, GJ16488; v, GJ16494; and vi, GJ18619/pHYD2388. WT, wild-type parent.

